

Executive Summary
- A Boston, Massachusetts-based mid-sized biopharmaceutical manufacturer engaged our team for a narrowly scoped, 9-week project after its first commercial launch product missed its year-one demand forecast by a wide margin first on the high side, leaving the company with finished-goods inventory well above actual demand and an unplanned inventory write-down conversation with the board, and then, after a late correction, on the low side, forcing an air-freight expedite from its CDMO to avoid a stockout.
- This was not a request to redesign supply chain planning company-wide. The client was explicit that they wanted one thing fixed: the forecasting method for the launch product, along with a lightweight way to keep Supply and Finance aligned on it going forward.
- We scoped the engagement accordingly: diagnose why the launch forecast kept missing, replace the method with one better suited to a product with under a year of shipment history, and build a monthly check-in cadence practical enough for a mid-sized organization to sustain without adding headcount. We deliberately did not touch the forecasting process for the company’s other commercial product, which was stable and not a source of complaints.
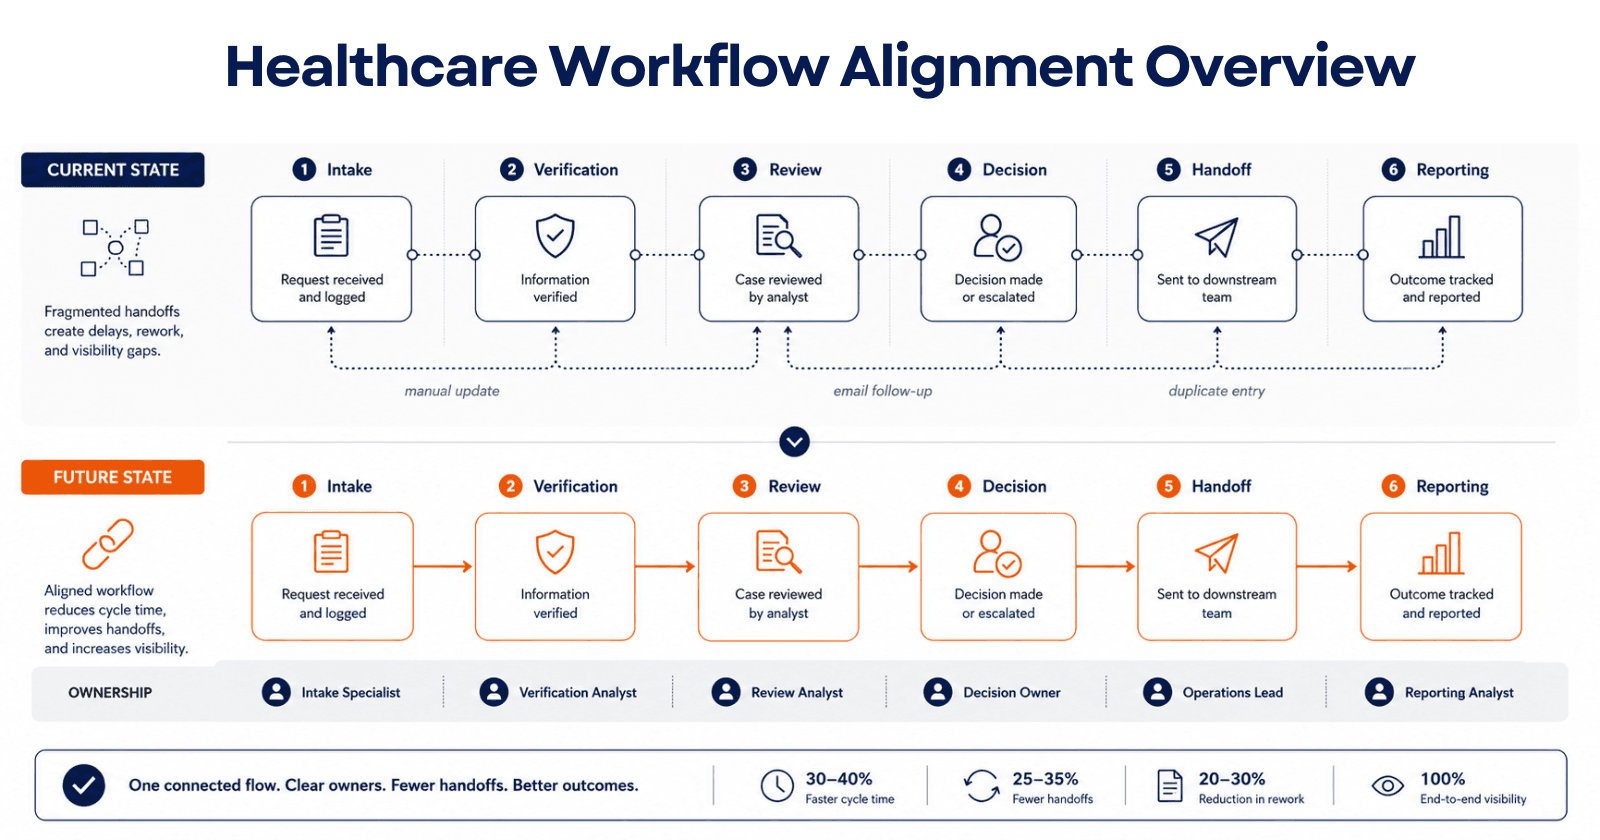
- Within two quarters of the new method going live, forecast bias on the launch product narrowed from a heavy, persistent over-forecast to something much closer to breakeven, and the company avoided a second expedite it had been on track to need.
- The fix did not solve everything. The underlying data problem limited, noisy early sales data does not fully go away just because the method changed, and we say more about the remaining risk in Section 8
What the Review Needed to Clarify
Forecast followed targets, not demand reality.
The same trend-based spreadsheet used for the stable commercial product was applied to a product only five months post-launch. That made the forecast depend too heavily on sales targets instead of actual shipment behavior and early market signals.
A lightweight forecast the whole planning group could use
The client needed a demand-planning method simple enough for a 150-person company to maintain, while still giving Commercial Operations, Supply, Finance, and the CDMO relationship owner better visibility before the forecast was finalized.
Forecast changes were reaching supply decisions too late
Because CDMO batch lead times ran 10–12 weeks, late forecast changes affected inventory, batch planning, air-freight risk, specialty pharmacy supply, and financial discussions after the planning window was already tight.
Separate the sales target from the supply forecast
The practical first step was to keep the sales target for commercial planning while creating a separate supply-facing forecast supported by shipment data, payer signals, analog comparison, Finance review, and CDMO timing.
Background
The client is a commercial-stage biopharmaceutical company with roughly 150 employees, one established commercial product, one product launched five months before the engagement began, and two earlier-stage pipeline assets in clinical development. Manufacturing runs through a single internal drug substance facility feeding one contract drug product manufacturer (CDMO), with distribution through a temperature-controlled 3PL into specialty pharmacy channels.
Demand forecasting for both commercial products was owned by a single Commercial Operations analyst who also had FP&A reporting duties; there was no dedicated demand planning function, which is typical at this size. For the established product, a simple trend-based spreadsheet forecast worked fine. Applied to the launch product, the same method produced a forecast built almost entirely on the sales team's top-down volume targets, with very little grounding in actual early prescription or shipment data.
Why the company sought outside help
The launch product's first-year forecast came in well above actual demand, and the resulting finished-goods build required an unplanned inventory write-down conversation with the board.
A subsequent quarter swung the other way: a late correction to the forecast came in too low, and the company had to air-freight drug products from its CDMO to avoid a stockout at specialty pharmacies.
The analyst responsible for the forecast had no formal method for a product with limited history, and was, in her own words, largely guessing with extra steps.
Leadership wanted a fix scoped tightly enough to implement without hiring, given the company's size and the cost pressure already created by the inventory write-down.
Initial Observations
We spent the first two weeks interviewing the eight people directly touching the launch product's demand signal Commercial Operations, the two field sales leads, the CDMO relationship owner, Finance, and the CEO and reviewing five months of actual shipment and prescription data against the original forecast. A few things were clear quickly.
The forecast method was inherited from a product it was never designed for
The trend-based method used for the established product assumes a stable base to trend from. Applied to a product five months post-launch, there was no stable base, the method was, in effect, extrapolating from noise.
Sales targets and the demand forecast were the same number
The launch product's forecast was, functionally, the sales team's target for the year, carried over into the supply planning spreadsheet without adjustment. This is a common and understandable shortcut at a company this size, but it meant the forecast had no independent check against what was actually happening in the market.
Early signal existed but wasn't being used
Weekly specialty pharmacy shipment data and payer coverage determinations both strong early indicators for a launch product were being received by Commercial Operations but weren't incorporated into the forecast in any structured way; they were referenced anecdotally in meetings, not built into the number.
The CDMO relationship owner had no visibility into the forecast until it was final
Batch lead times at the CDMO run 10–12 weeks. The forecast was shared with the CDMO relationship owner only after it was finalized for the quarter, leaving no room to flag that a step-up in volume assumptions might not be executable in the required window.
Review & Design Approach
Given the tight scope, we didn't build a portfolio segmentation framework or touch decision rights company-wide that would have been over-engineering for a company with two commercial products and no dedicated planning function. Instead we focused on three questions specific to the launch product: what data actually predicts its demand this early, who needs to see the forecast before it's finalized, and what's the smallest cadence that keeps Supply and Finance from being surprised.
Step 1 — Identify a better data foundation for an early-launch product
We tested three candidate inputs against the five months of actual data: an analog forecast built from two comparable specialty launches the CEO had been involved with at a prior company, weekly specialty pharmacy shipment data, and payer coverage determination timing. The analog and shipment-data combination tracked meaningfully closer to actuals than the existing sales-target method; payer coverage timing turned out to be a weaker predictor than expected for this specific product and we dropped it from the model rather than force a fit.
Step 2 — Separate the sales target from the supply forecast
We proposed keeping the sales team's target for incentive-compensation purposes, but building the supply-facing forecast as its own number, generated from the analog-and-shipment-data method, with the gap between the two made visible rather than hidden.
Step 3 — Build the smallest cadence that closes the CDMO visibility gap
Rather than a full S&OP process, we designed a 45-minute monthly check-in Commercial Operations, the CDMO relationship owner, and Finance timed to land before each CDMO batch-slot commitment deadline, so a forecast change had a real chance of affecting the next order rather than arriving after the window had closed.
Step 4 — Pilot for two cycles before calling it done
We ran the new method alongside the old one for two monthly cycles before formally replacing it, specifically so the client could see both numbers side by side and decide for themselves whether the new method was actually better, rather than take our word for it. The design phase had one real point of friction: the Commercial Operations analyst was, understandably, uneasy about a method that made the gap between the sales target and the supply forecast explicit, since it would be visible to Finance and the CEO. We spent part of week 3 reworking how that gap was presented, framing it as a normal feature of early-launch forecasting rather than a discrepancy to be explained away before she was comfortable running with it.
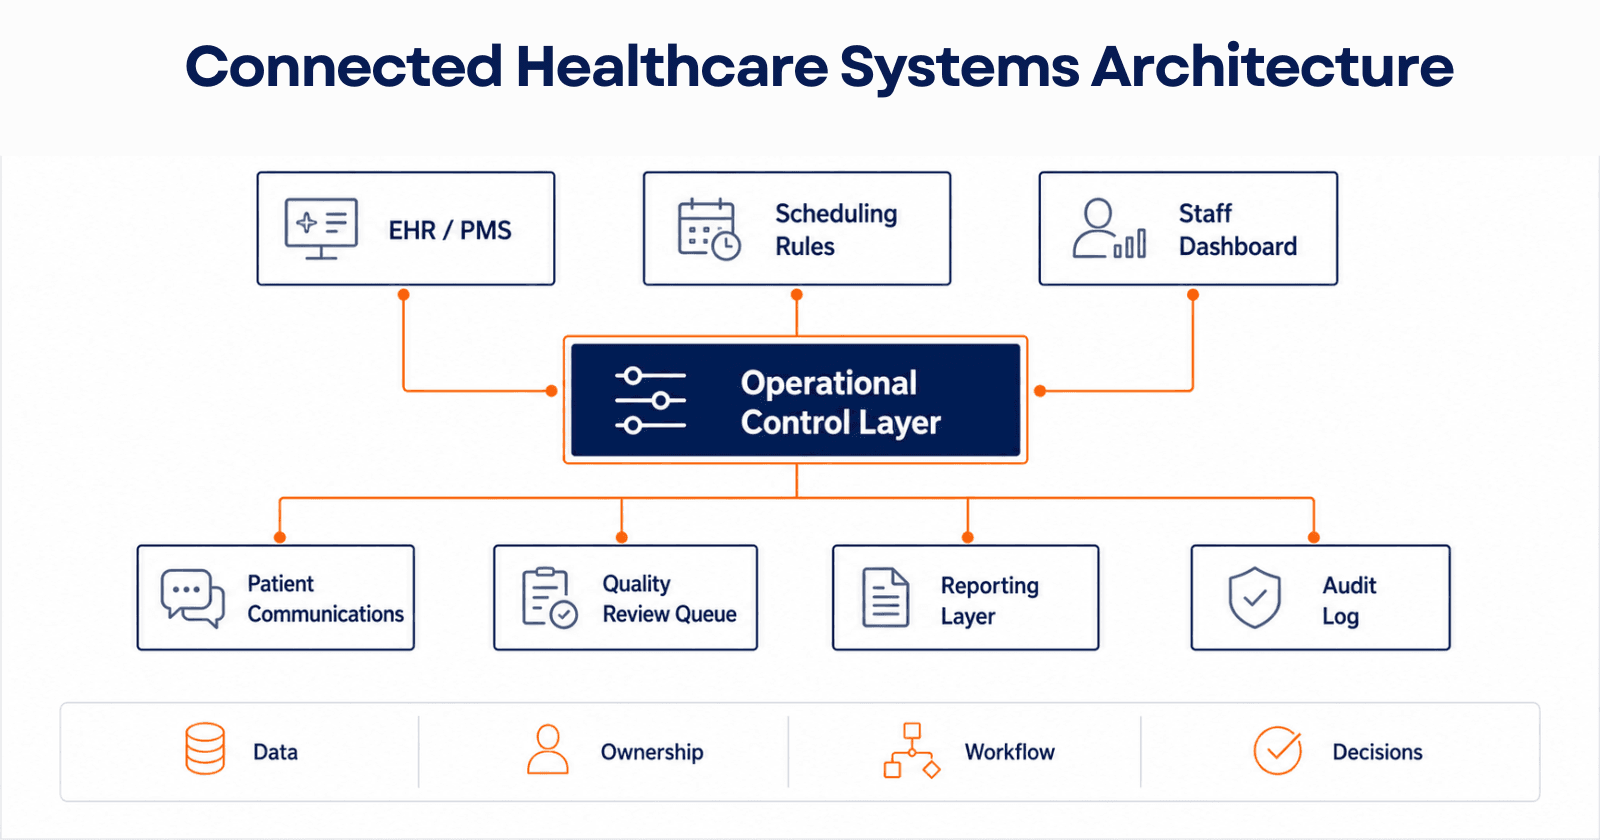
Two people worked the engagement from our side: a lead consultant and a supply planning analyst, at roughly three days a week combined. On the client side, this involved the Commercial Operations analyst (the primary counterpart), the CDMO relationship owner, and the CFO for two design checkpoints with no new hires or dedicated project team, consistent with the client's ask to keep this lightweight.
Key Findings
The forecast error wasn't random, it was structurally biased high. Every one of the five months of actuals came in under the sales-target-based forecast, by a wide and fairly consistent margin, which is the signature of a target being used as a forecast rather than a genuine miss.
Weekly shipment data was the single best predictor available and was already being collected, it just wasn't connected to anything. This was the most encouraging finding of the engagement: the fix didn't require new data infrastructure, only a structured way to use data the company already had.
The CDMO's 10–12 week lead time meant the company was structurally exposed to any forecast miss discovered late. Even a correct forecast delivered too late to affect the next batch commitment was operationally almost as bad as a wrong one.
Payer coverage timing, which the client's leadership had assumed would be a strong signal, was not a reliable predictor for this particular product, coverage came through faster than typical but didn't correlate cleanly with the shipment ramp. We flagged this explicitly rather than force it into the model because it fit the narrative.
There was no capacity gap or resourcing problem behind the forecasting issue one analyst, doing the work by hand with a better method, was enough to close most of the gap. This mattered for scoping the fix: the client did not need to hire a demand planner to solve this.
Decisions & Solution
Based on the findings, the client made three targeted decisions deliberately not a company-wide process overhaul, since that wasn't what the engagement was scoped to fix.
Replaced the launch-product forecasting method
The sales-target-based forecast was retired for supply planning purposes and replaced with the analog-plus-shipment-data method, refreshed monthly using the latest weekly shipment actuals rather than rebuilt from scratch each cycle.
Split the sales target from the supply forecast
The sales team kept its own target for compensation purposes, but the number that drove CDMO orders and inventory decisions became a distinct, separately owned figure with the gap between the two shown explicitly each month rather than reconciled away.
Stood up a 45-minute monthly forecast check-in tied to the CDMO's ordering calendar
Commercial Operations, the CDMO relationship owner, and Finance now meet monthly, timed roughly three weeks ahead of each batch-slot commitment deadline, specifically so a forecast revision has time to change the order rather than arrive after the window has closed.
I was nervous the first time Finance saw the gap between our sales target and the actual supply number laid out like that. But nobody panicked it turned out that was the point. Now I'd be more worried if the two numbers matched exactly.
Implementation
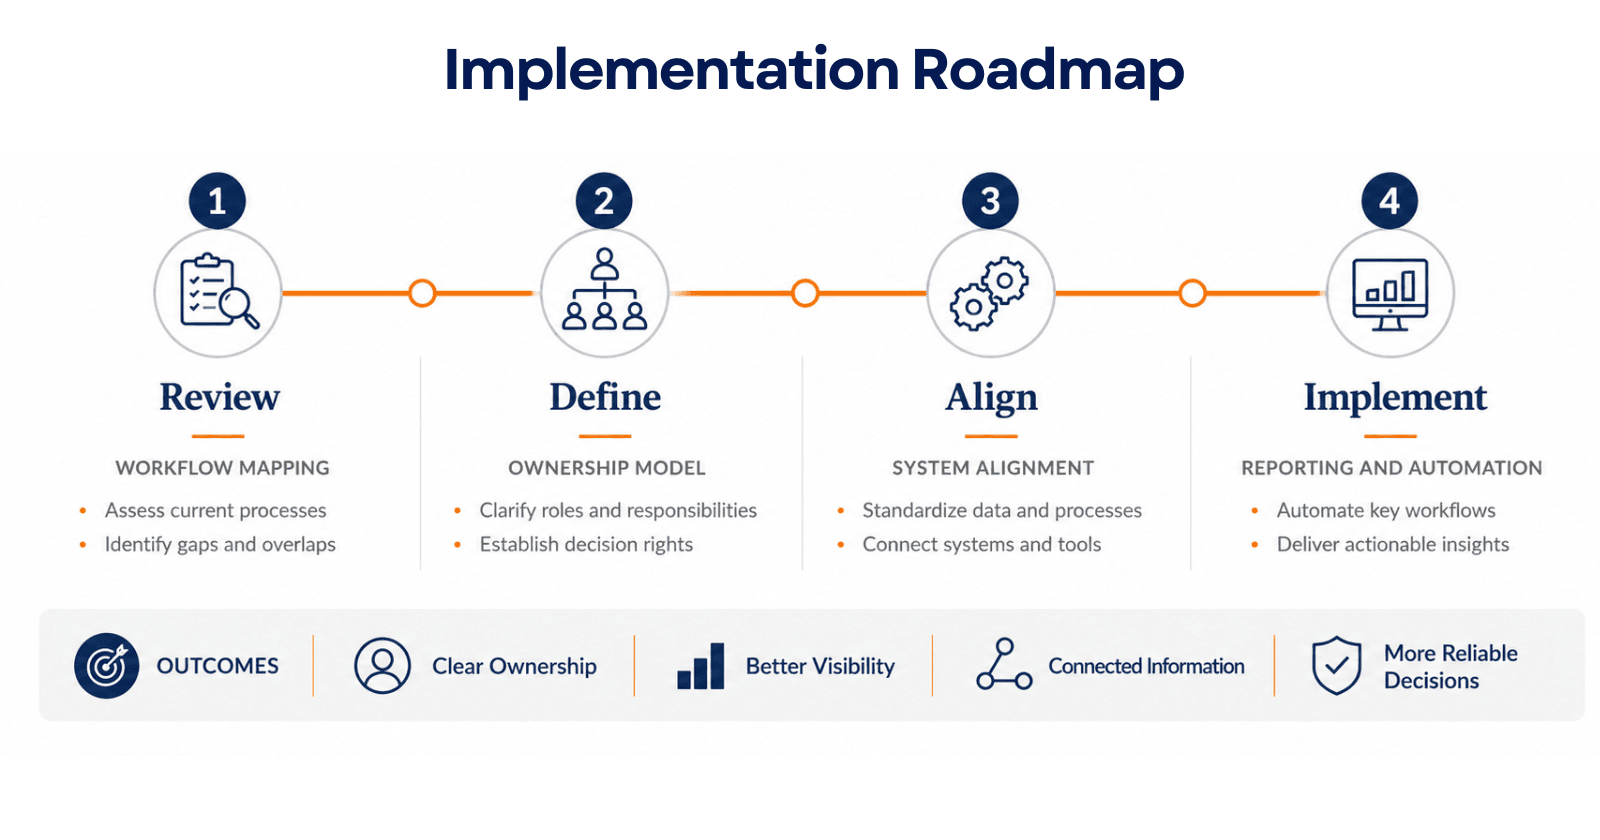
Implementation ran nine weeks in two phases, sized to match a company that wasn't going to add headcount to run this.
Phase 1 (Weeks 1–5): Build and pilot the new method
We built the analog-plus-shipment-data model in the same spreadsheet environment the analyst already used, deliberately avoiding new software given the team's size, and ran it in parallel with the old method for two monthly cycles. The first parallel cycle was messier than expected the analog data from the CEO's two reference launches turned out to be formatted inconsistently with the client's own shipment data, and we lost most of a week reconciling units (packs vs. vials) before the comparison was usable.
Phase 2 (Weeks 6–9): Cut over and hand off the monthly check-in
With two clean parallel cycles showing the new method tracking closer to actuals, the client formally retired the old forecast for the launch product. We facilitated the first two monthly check-ins with the CDMO relationship owner and Finance, then handed off facilitation to the Commercial Operations analyst. The second check-in ran long and inconclusive the CDMO relationship owner raised a batch-slot constraint that hadn't been discussed in Phase 1, and the group didn't have a way to resolve it in the meeting, so it was worked offline over the following week rather than in real time.
Change management
The CDMO relationship owner was added as a standing participant in the monthly check-in, replacing the prior pattern of only being looped in once a forecast was already final.
The forecast spreadsheet was restructured so the sales target and the supply forecast sit side by side on the same tab, making the gap visible by default rather than something someone has to go looking for.
We wrote a two-page method guide not a full playbook, given the scope covering how to refresh the model monthly and what to do if the analog comparison stops tracking well as more actual data comes in.
Impact
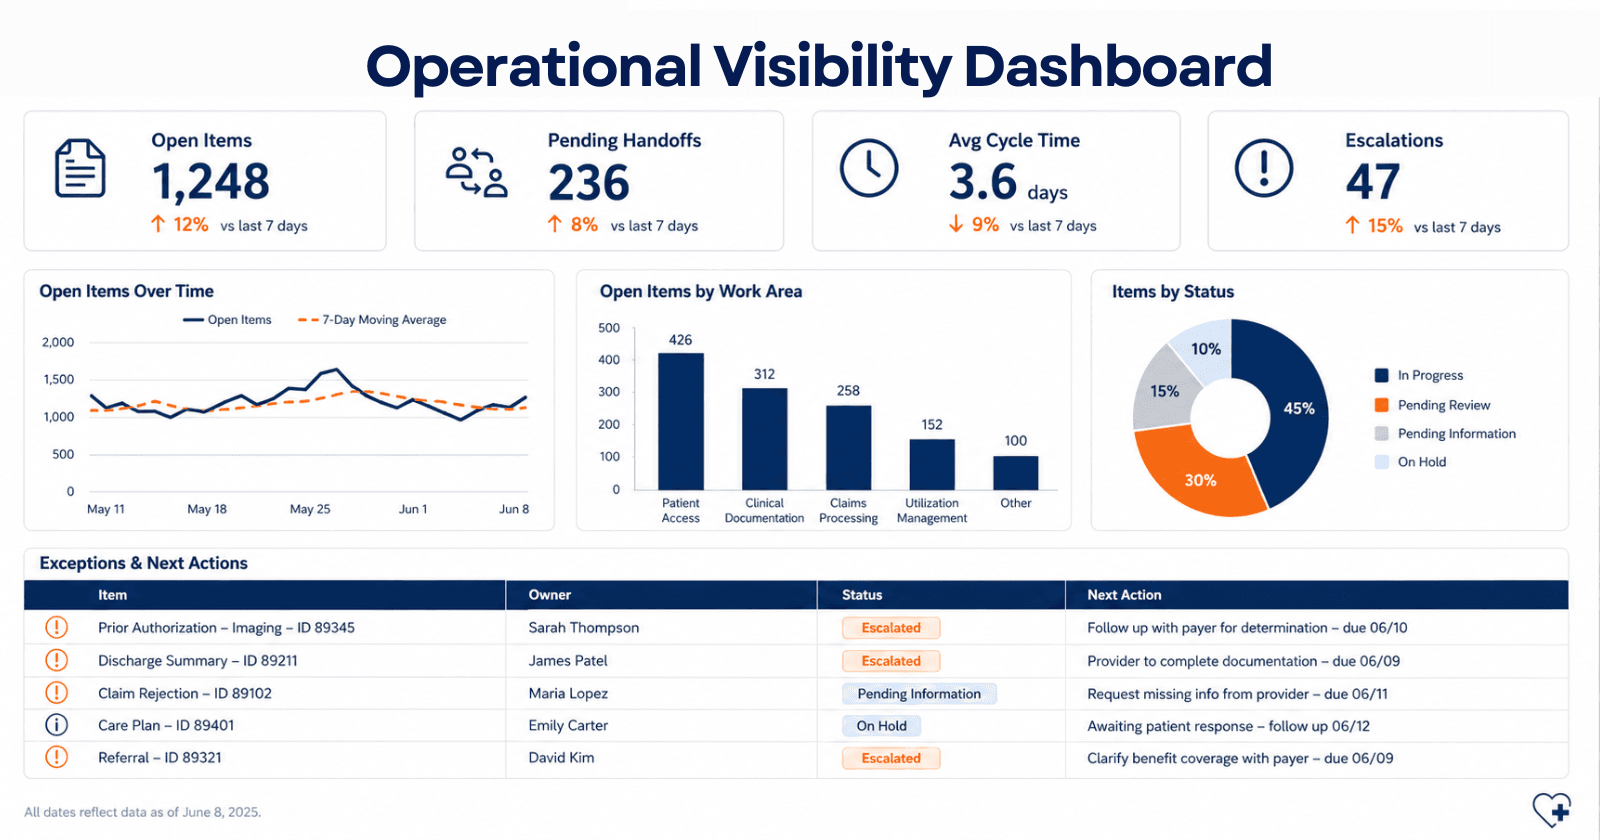
Results below reflect the two full quarters following cutover, compared to the five months of actuals-versus-forecast data reviewed at the start of the engagement.
| Metric | Before | After (2 quarters post-cutover) |
|---|---|---|
| Launch-product forecast bias | Persistent over-forecast, roughly 35–45% | Roughly breakeven to a low-single-digit over-forecast |
| Launch-product forecast error (MAPE) | High-30s to mid-40s % | Roughly 12–18% |
| Expedited (air-freight) CDMO orders tied to demand surprises | 1 in the prior 5 months | 0, though the company came close in month 2 post-cutover |
| Lead time between forecast revision and CDMO order deadline | Often <2 weeks, sometimes after the deadline had passed | Typically 3+ weeks |
| Monthly forecast check-in in place with CDMO visibility | No | Yes, though one cycle ran over and had to be resolved offline |
Figures above are rounded and directional at the client's request, and two quarters is a short window for a product still five to seven months into its launch. We'd treat this as a strong early result rather than a fully settled trend. The client's own read, echoed by the CFO in a wrap-up call, was less about the specific percentages and more that Finance and the CDMO relationship owner now saw the forecast change coming instead of hearing about it after the fact.
What didn't fully resolve
Two things were still open when the engagement closed, and we said so directly rather than calling the rollout finished.
The analog comparison depends on two reference launches from the CEO's prior company. As the client's own launch accumulates more months of real data, the model will need to lean less on those analogs and more on its own history. We recommended a checkpoint at month nine to re-test the model, but did not build that re-test since it falls outside the engagement window.
The method still depends on one person. With no dedicated demand planning function, the Commercial Operations analyst remains the only one who can run the monthly refresh; the two-page guide reduces but doesn't eliminate that dependency.
Why This Worked
The scope matched the company's size. A full S&OP redesign would have been the wrong prescription for a 150-person company with one analyst touching demand planning a tightly scoped fix that person could actually run herself was more likely to survive past the engagement.
The new method used data the company already had. Because weekly shipment data was already being collected, the fix was about structure and discipline, not new systems or new headcount, which kept it realistic to hand off in nine weeks.
Separating the sales target from the supply forecast removed the incentive to fudge the number. Once the two figures were allowed to legitimately differ, there was no reason for the forecast to quietly track the sales target instead of the market.
Piloting in parallel before cutover built trust without asking anyone to take our word for it. Showing the client two cycles of side-by-side comparison data meant the decision to switch methods was theirs, based on evidence they'd watched accumulate.
What we'd do differently: we underestimated how much friction the CEO's analog data would introduce (unit mismatches cost most of a week), and would sense-check that data's structure against the client's own data formats in week one rather than week three. We'd also build the month-nine model re-test into the original scope rather than leaving it as a recommendation, since a model this dependent on two analog data points needs a planned check-in, not just a suggestion to revisit it.
Note on Confidentiality
This case study is based on an actual advisory engagement. In accordance with our client confidentiality commitments, the company name, product names, specific dates, and precise financial figures have been altered or generalized, and all quantitative results are presented as representative ranges rather than exact figures. No confidential or proprietary client information is disclosed. This document is intended to illustrate our approach and is shared with the knowledge and consent of the client.
If you are considering a similar engagement and would like to speak with this client as a reference, we are glad to arrange an introduction with their permission.