Dashboards & Operational Visibility

One View Into Production, Quality, and Delivery Instead of Five Disconnected Systems

Health & Life Sciences organizations typically juggle daily tasks involving ERP, QMS, LIMS, MES, spreadsheets, emails, and manual reporting. It's not like there's no data. The problem is that the teams are not able to see the right status, risk or next action in one trusted view. Gyan Solutions assists teams in creating dashboards and reporting views that integrate and present a single, clearer view of production, quality, supply, delivery, and leadership.

Discuss Dashboard Visibility

Start by finding where reporting and system visibility break down.

Live Operations Dashboards

See batch progress, open actions, quality status, release readiness, and delivery signals in one working view.

Quality and Compliance Reporting

Track deviations, CAPA status, audit readiness, document gaps, review timelines, and recurring quality risks.

Cross-System Data Visibility

Bring ERP, QMS, LIMS, MES, spreadsheets, and partner updates into one reporting layer your team can trust.

Executive and Board Reporting

Turn operational data into clear leadership views for performance, risk, capacity, delivery, and business decisions.

Team Experience

Senior experience across pharmaceutical, regulated manufacturing, quality, supply, and life sciences operations.

Built for Regulated Visibility

Designed around audit readiness, quality status, release signals, documentation gaps, and operational reporting needs.

Built Around Existing Systems

ERP, QMS, LIMS, MES, spreadsheets, and dashboards connected around the data teams already use.

Where Visibility Gaps Appear

Dashboards typically are required once the business has already invested too much time in discovering the facts. Reports are manually generated. Quality updates are in one system. There is a different place for the production status. Spreadsheets can be used to monitor delivery or supply information. The leadership team receives a delayed view, and teams discover what they need to focus on now.

Manufacturing Sees Every Risk

Production teams may know work is moving, but not always see the full picture: batch progress, holds, exceptions, release status, open actions, and delivery impact.

Quality Looks Late

Quality teams may have deviation, CAPA, audit, or document data, but that information may not reach operations early enough to prevent delays.

No Single Source of Truth

Teams compare ERP exports, QMS records, LIMS updates, spreadsheets, and meeting notes just to understand what is actually happening.

Shop Floor Knows Before Leadership

Operational issues often appear on the floor before they appear in reports. By the time leadership sees the problem, the delay may already be growing.

Audit Readiness Takes Too Long

When records, actions, approvals, and status updates are spread across systems, preparing for audits or inspections takes more manual effort than it should.

Every Site Reports Differently

Different teams, plants, or business units may report the same work in different ways, making it hard to compare performance or risk.

Visibility gaps slow decisions, increase risk, and make regulated reporting harder than it needs to be.

The first step is not another dashboard. It is understanding which systems, reports, and data sources need to connect.

Seeing these gaps in your operation?

Start a Dashboard Visibility Review

A Dashboard Is Only as Good as What Feeds It

Many Dashboard projects get off to a wrong start by beginning with charts rather than data.

A useful dashboard must have more to it than just visuals. It must have clean sources, clear definitions, trusted ownership and a reporting system that is appropriate to the way the operation operates. Before creating the dashboard, we first review the workflow, systems, data sources, reporting gaps and decision needs.

Dashboard data connection diagram
1

Map Your Systems

We review where the data lives today across ERP, QMS, LIMS, MES, spreadsheets, databases, and manual trackers.

2

Define Data Ownership

We clarify which source is trusted for each metric, who owns the data, and where manual updates or duplicate entries create risk.

3

Build the Dashboard

We design dashboard views around the real decisions teams need to make, not generic charts that look good but do not guide action.

A dashboard should not just display data. It should show what needs attention, who needs to act, and where the operation is starting to drift.

Live Operations Dashboards

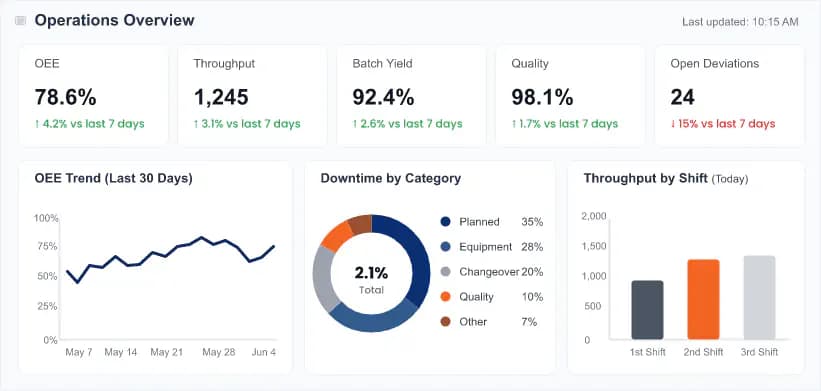
Real-time operational dashboards enable teams to view what's moving, what's delayed and what needs attention before it becomes a large operational issue.

This visibility can show batch progress, QA holds, release readiness, throughput, downtime, trends in deviations, site performance, and open actions by shifts and sites, for health and life sciences teams. Gyan Solutions creates dashboard views based on what your team needs to decide, not on what can be found in the system.

Live operations dashboard

OEE & Throughput Tracking

See availability, performance, downtime, output, and quality signals from production systems in one view, so teams can act on delays earlier.

Batch Yield & Deviation Trends

Track batch results, yield changes, open deviations, recurring issues, and quality patterns before small problems become repeated exceptions.

Shift & Site Comparison Views

Compare shifts, teams, lines, or sites without rebuilding reports each time, so leaders can see where support or action is needed.

See what is happening, not what already happened.

Live operational dashboards help teams act earlier, reduce risk, and drive better outcomes across every site and shift.

Seeing these gaps in your operation?

Start a Dashboard Visibility Review

Compliance & Audit Reporting

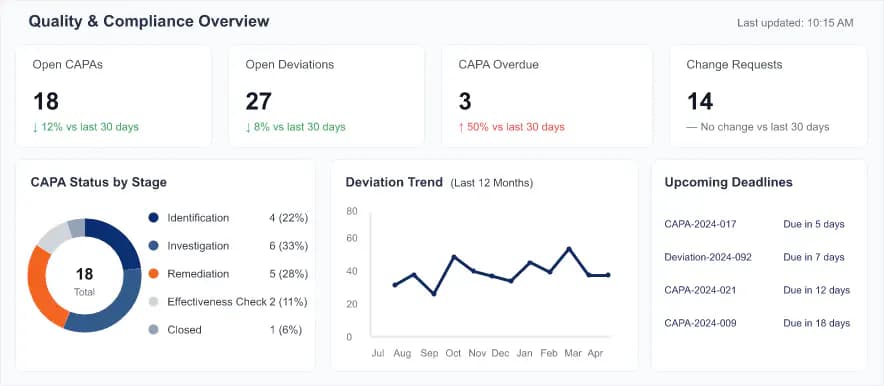
Quality, compliance and documentation are typically stored in QMS, spreadsheets, shared folders, emails, and individual team trackers. It makes it more difficult to see what is open, what is overdue, what is ready and what does not have evidence.

Gyan Solutions creates compliance and audit reporting views to consolidate important views like CAPA status, deviation trends, change control, audit actions, document gaps, owners, due dates, readiness items, etc. The goal is simple: Making it easy for regulated teams to spot risk early, prepare quickly and never again have to build the same status report over and over when someone asks.

Live operations dashboard

CAPA & Deviation Status in One View

Track open CAPAs, deviations, owners, aging items, due dates, remediation progress, and recurring issue patterns before anything falls through the cracks.

Audit-Ready Export

You can build a report that has history, attachments, owners, approvals and evidence links, ensuring that teams aren't looking for records at the last minute.

Change Control Visibility

View pending and completed changes, approval dates, review status, affected systems, actions that are pending, and updates that are QA ready in one controlled view.

Prepared when it matters.

Compliance dashboards help teams see open actions, missing evidence, and readiness gaps before the audit or inspection pressure starts.

Seeing these gaps in your operation?

Review Compliance Reporting Needs

Cross-System Data Integration

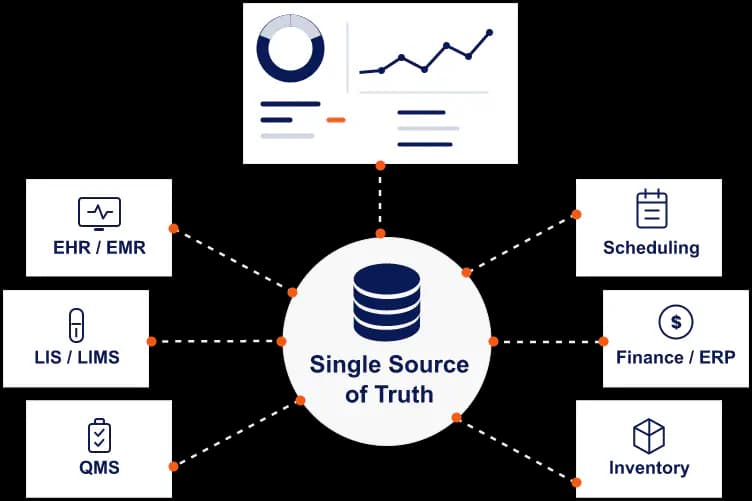
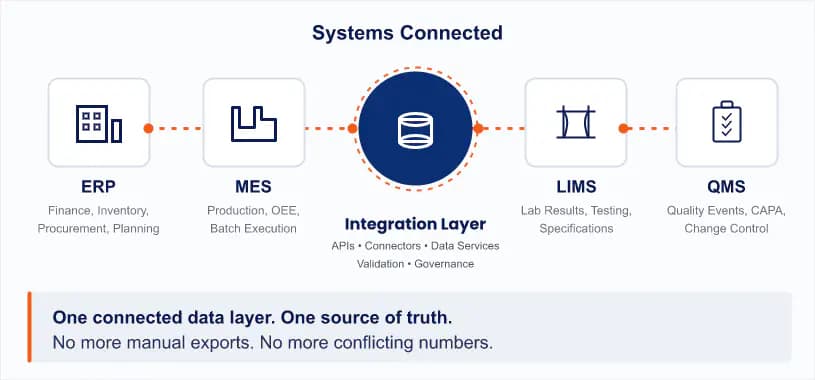
Visibility breaks when every system tells a different part of the story. In health and life sciences operations, production data may sit in MES, inventory in ERP, lab results in LIMS, quality actions in QMS, and the “working truth” in spreadsheets. When those sources do not connect, teams lose time reconciling numbers instead of making decisions.

Gyan Solutions builds the integration layer that brings these sources together, so dashboards are based on trusted data, not manual exports and conflicting versions.

Discuss Your Integration NeedConsulting and implementation are scoped separately.
Systems connected integration diagram

ERP → MES → LIMS → QMS Connections

We connect production, inventory, lab, quality, release, and change-control data so teams can see the full operating picture without rebuilding reports by hand.

  • tick iconEliminates manual reconciliation and spreadsheet risk
  • tick iconKeeps reporting data consistent and current
  • tick iconReduces cycle time for reporting and decisions

Legacy System Bridging

When old systems still run critical work, we do not force replacement too early. We help bridge legacy platforms into modern reporting views where it makes sense.

  • tick iconConnects older systems to modern reporting layers
  • tick iconUses APIs, files, databases, and custom connectors where needed
  • tick iconPreserves important historical data while improving visibility

One connected data layer. One source of truth.

No more manual exports. No more conflicting numbers. Just cleaner reporting across the systems your team already uses.

Executive & Board Reporting

Leadership must not be dependent on manual slides, spreadsheets summaries and individual team updates to know what is going on in the operation.

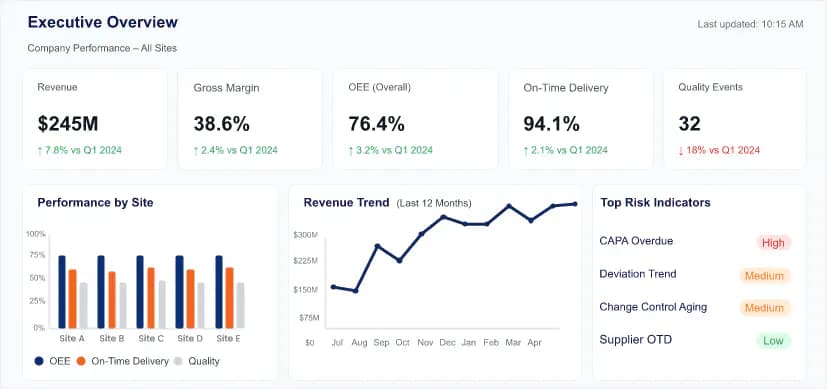
In health and life sciences environments, executive reporting needs to show more than performance numbers. It should make quality risk, delivery status, site performance, open actions, supply pressure, and operational trends easier to see before decisions are delayed. Gyan Solutions creates executive and board reporting views that consolidate all your operational data in one place, providing a harmonized view that leaders can rely on.

Discuss Your Reporting Needs Consulting and implementation are scoped separately.
Executive Reporting diagram

Rollup Dashboards for Leadership

A clear leadership view built from the operational dashboards, systems, and reporting sources your teams already use.

  • tick iconHighlights the metrics that drive business outcomes
  • tick iconSupports executive, board, and investor reporting
  • tick iconShows performance across operations, quality, delivery, supply, and sites

Multi-Site Consolidated Reporting

One consistent reporting format across teams, sites, plants, or business units, refreshed on the same cadence.

  • tick iconStandardizes metrics and definitions across sites
  • tick iconReduces manual report building and copy-paste errors
  • tick iconMakes performance easier to compare across the organization

Executive visibility drives better decisions.

The right information, in the right format, at the right time.

Seeing these gaps in your operation?

Build Executive Reporting Clarity

Technologies We Work With for Dashboards,
Reporting, and Data Visibility

Most health and life sciences teams already have the tools! The true challenge is that data is typically distributed across BI platforms, spreadsheets, databases, shared files and disconnected systems. Gyan Solutions enables you to integrate the stack you already have, allowing you to have clearer numbers on dashboards, less manual exports and a more trusted view of what's happening across the operation.

BI & Reporting

BI & Reporting technology 1BI & Reporting technology 2BI & Reporting technology 3BI & Reporting technology 4
Dashboards, KPI reporting, operational scorecards, and leadership views built around real reporting needs.

Data & Platforms

Data & Platforms technology 1Data & Platforms technology 2Data & Platforms technology 3Data & Platforms technology 4
Warehousing, query layers, reporting databases, and structured data foundations for cleaner dashboard output.

Integration & Collaboration

Integration & Collaboration technology 1Integration & Collaboration technology 2Integration & Collaboration technology 3Integration & Collaboration technology 4
Workflow inputs, file handoffs, API connections, report refreshes, and collaboration points connected into the reporting process.

Built Around Your Existing Stack

We connect with the tools your team already uses, so reporting improves without forcing a platform replacement.

Connect Your Reporting Stack

Selected Case Studies

Real outcomes from our operations consulting and implementation engagements.

Loading case studies...

Watch Our Solutions in Action

Supply chain command center dashboard preview

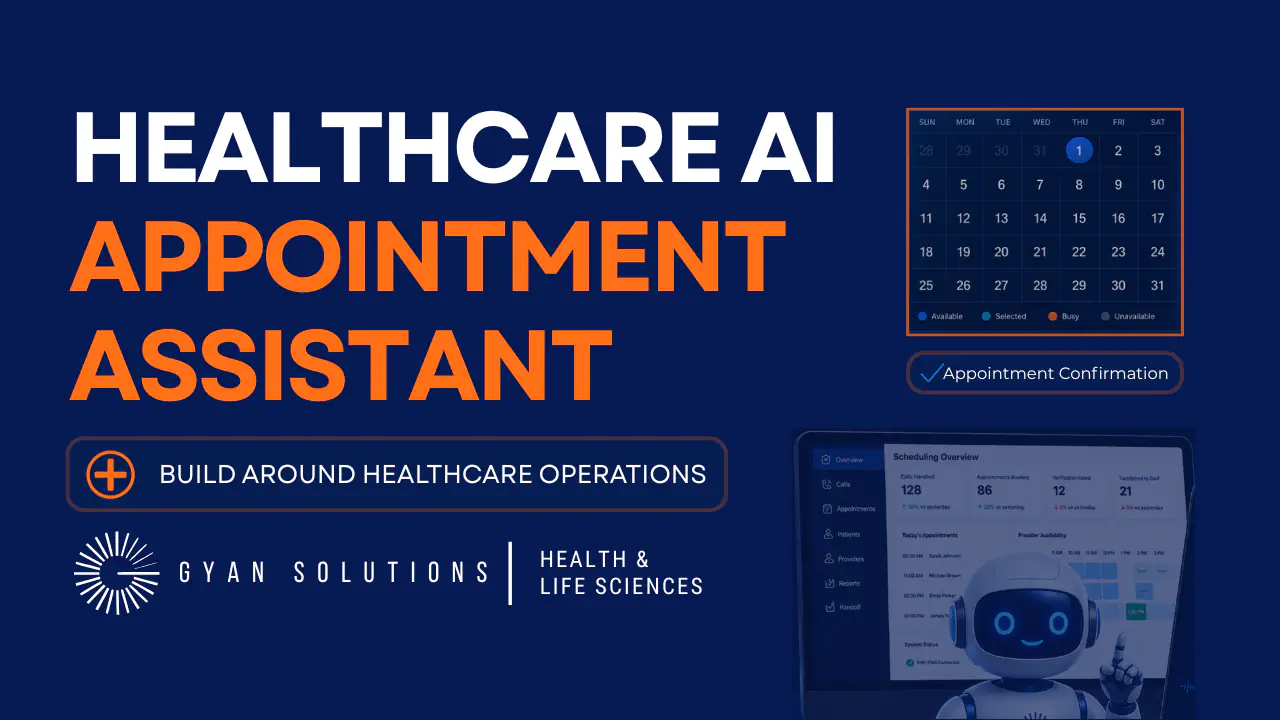
AI Appointment Scheduling Assistant for Clinic Operations

See how Gyan Solutions Health & Life Sciences experts designed an AI-enabled scheduling workflow around patient verification, provider availability, EHR/PMS updates, confirmation steps, and safe staff handoff.

  • Check iconVerify patients before system changes
  • Check iconCheck provider availability and scheduling rules
  • Check iconSend confirmation details after booking
  • Check iconTransfer safely when human review is needed

What Clients Say

Real outcomes from operations consulting and implementation work that drives clarity, efficiency, and measurable business impact.

Dr. Jason Jawanda
Dr. Jason Jawanda

Dr. Jason Jawanda

Director

Gyan Solutions understood that we needed more than a standard booking tool. They translated our clinic’s scheduling requirements into an AI-assisted operator that could support appointment inquiries, booking, and staff handoffs while keeping our team in control of the process.

★★★★★
5.0 out of 5
Adrien Kabamba
Adrien Kabamba

Adrien Kabamba

Director of Quality at Pharma PPI

Gyan Solutions brought a structured and practical approach to our work. They understood the importance of clear processes, defined accountability, and solutions that could operate effectively within a quality-focused pharmaceutical environment.

★★★★★
5.0 out of 5

Clinical-Stage Biotechnology Company

Executive Director, CMC

Gyan Solutions brought structure and visibility to a complex clinical-stage development program. They took the time to understand the dependencies across CMC, Quality, Clinical Operations, supply, and external partners, then established a practical framework that improved ownership, coordination, and decision-making without disrupting our existing systems.

★★★★★
5.0 out of 5

Turn the Missing Workflow Into a Working Tool.

Build around the handoffs, approvals, and gaps your current systems do not cover.

Request a Free Operations Fit Call
Operations consulting meeting
icon

30-minute call

icon

No obligation

icon

Consulting and implementation scoped separately

Common Questions

Why do our dashboards still feel unreliable if we already have ERP, QMS, LIMS, or MES?

Each system may display only a section of the operation. In addition to showing inventory or production data, ERP might display deviations or CAPA, QMS might display deviations or CAPA, and LIMS might display deviations or testing status, with the working view still in a spreadsheet.The first step to creating a helpful dashboard is to establish who is responsible for what data, where there are manual updates, and what teams really need to trust before making decisions.

Can you help us build one view across production, quality, release, and delivery?

Yes. Gyan supports teams to check the flow of production status, quality events, release readiness, open actions, supply signals and delivery updates across the systems.It is not the objective of creating charts. The purpose is to provide Operations, Quality and Leadership with visibility of what is in motion, what is stuck and what requires focus.

How do we know which data should feed the dashboard?

First we look at the source systems, reporting logic and data ownership, and decisions the dashboard must make. It is important because if the wrong source is used or the definitions are not understood or different teams trust different numbers, there's a risk of confusion on dashboards.

Can dashboards support audit readiness and quality reporting?

Yes, when they are built around the right workflow and data sources. Dashboards can help teams see deviations, CAPA aging, audit findings, change control status, document gaps, overdue reviews, and readiness tasks.They do not replace quality processes, but they can make open work, owners, timing, and risk easier to see.

How is a health and life sciences dashboard unique?

A normal dashboard may only discuss the performance numbers. Workflow status, quality events, records, approvals, data integrity, release readiness and cross-functional ownership are just a few of the things that a health and life sciences dashboard has to cover.

Let's Connect

Request a Free Operations Fit Call

Tell us a bit about your goals and challenges. We'll schedule a 30-minute Operations Fit Call to understand your needs and recommend the right next steps.

30-minute call

Focused on your goals

No obligation

You decide the next step.

Scoped separately

Consulting & implementation

Your information is secure and never shared.