


Operational reporting and decision support dashboard

OPERATIONAL VISIBILITY & DECISION SUPPORT

Operational Reporting Built Around Better Decisions

Turn operational data into clear dashboards, reporting, exception visibility, and decision-ready information. Gyan Solutions helps organizations bring information together from ERP, CRM, spreadsheets, databases, operational systems, and other sources so teams can understand what is happening, where attention is needed, and what should happen next.

Discuss Your Reporting Requirement

Start with the decisions people need to make before deciding what the dashboard should show.

Operational Dashboards

Bring critical workflow, performance, status, and exception information into clear role-based dashboards.

KPI & Management Reporting

Create reporting around the measures leaders and operational teams actually use to manage performance.

Exception & Bottleneck Visibility

Surface delays, missed handoffs, backlog, thresholds, incomplete work, and other conditions requiring attention.

Multi-System Reporting

Combine data from ERP, CRM, spreadsheets, databases, applications, and operational systems into a more complete view.

08+

Years of Implementation Experience

150+

Projects Delivered Successfully

25+

Industries Supported

30–40%

Average Efficiency Improvement

Our Engagement Experience
Check icon
Check icon
Check icon
Check icon

Two Ways We Support Operational Reporting

Some organizations know they lack visibility but aren't yet sure whether the real gap is reporting, data quality, or ownership. Others already know the operational reporting they need and want the right team to build it. Choose the path that matches where you already have clarity.

Operational Review & Improvement

For organizations facing poor visibility, delayed numbers, or unclear ownership but who need to understand the workflow before deciding what to report.

  • Check iconReview workflows, decisions, KPIs, ownership, spreadsheets, and existing reporting routines
  • Check iconIdentify where information arrives late, lacks context, or fails to support real decisions
  • Check iconDetermine whether the fix is process redesign, ownership clarity, data alignment, or reporting
Request an Operations Fit Call
Info icon

Operational Review & Improvement can stand alone as a complete engagement, from diagnosis through improvement.

Technology & AI Implementation

For organizations that already have a clear dashboard, KPI, exception-monitoring, or decision-support requirement and need it built.

  • Check iconTurn the defined requirement into a clear data, dashboard, and delivery plan
  • Check iconBuild role-based dashboards, KPI views, exception reports, and live operational reporting
  • Check iconConnect reporting with ERP, CRM, spreadsheets, databases, and existing operational systems
Talk Reporting Implementation
Info icon

Technology & AI Implementation can be engaged independently or alongside operational review work.

Operational Reporting & Decision Support Capabilities

A useful dashboard should do more than display data. It should help a specific user understand what is happening, where something is changing, what requires attention, and which underlying information supports the decision.

Operational Dashboards

Give teams a clearer view of what is happening across day-to-day operations.

What It Is

Dashboards that combine relevant workflow, status, performance, workload, and exception information into a role-specific operational view.

When You Need It

When teams depend on multiple spreadsheets, system screens, emails, or manually prepared reports to understand current operational status.

What We Deliver

  • Real-time or scheduled dashboards
  • Operational status views
  • Workload visibility
  • KPI cards
  • Trend views
  • Role-based views
  • Exception indicators
  • Drill-down capability
  • Source-system connections

When Operational Reporting Becomes the Right Move

Every business reaches a point where teams have data but still can't clearly see what's happening. That is usually the moment operational reporting becomes the smarter move.

Reporting becomes necessary when your team has data but still can't see what's happening.

The problem is rarely a lack of information. More often, information is spread across systems, arrives too late, gets manually reconstructed, or shows up without the context needed to act on it.

Good operational reporting closes that gap. It shortens the distance between an operational event and the decision that follows it, giving the right person clear visibility, earlier awareness, and consistent numbers they can actually trust.

Signs Your Reporting Environment May Need Attention

  • Check iconManagers depend on spreadsheets to understand current operations.
  • Check iconReports are prepared manually every week or month.
  • Check iconTeams disagree about KPI definitions or which numbers are correct.
  • Check iconOperational issues are discovered only after deadlines are missed.
  • Check iconLeaders cannot easily identify exceptions or bottlenecks.
  • Check iconReporting requires manual exports from several different systems.
  • Check iconDecision-makers lack access to the drill-down detail behind the totals.

Why This Matters

More dashboards aren't the goal. Clearer visibility, earlier awareness, and numbers people trust are so the right person can act at the right moment.

Find the Right Reporting Direction

Why We Start With the Decision, Not the Dashboard

Most dashboards fail when teams start building before the real decision is clear. We start with the user, the decision, and the data behind it, so the final reporting actually drives action.

Step 1

Understand the Decision & Workflow

We review the users, roles, decisions, and existing reports behind how work moves today — including the systems, spreadsheets, and manual reporting already in place. This shows where information arrives too late, lacks context, or fails to support the decisions teams actually need to make.

Step 2

Define the Reporting Model

We turn the workflow into a clear reporting scope: which KPIs matter, where the data comes from, how often it needs to refresh, and who owns each number. This keeps the build focused on decisions, not just data.

Step 3

Build, Connect & Validate

We build the dashboards, reports, and data pipelines around the defined model, then validate the output directly with the people who will use it to make decisions — not just the people who requested it.

Not sure whether the problem is reporting, data quality, or ownership?

Not sure whether the problem is reporting, data quality, or ownership? We'll help you see whether the right next step is a dashboard build, or whether the real gap is workflow, data, or ownership.

Request a Reporting Fit Call

Reporting & Data Technologies We Work With

Technology is selected around the reporting requirement, source systems, data volume, refresh needs, user environment, security, maintainability, and existing technology stack.

Business Intelligence

  • icon

    Power BI

  • icon

    Tableau

  • icon

    Metabase

  • icon

    Custom operational dashboards

Custom Reporting Applications

  • icon

    React

  • icon

    Next.js

  • icon

    Vue

  • icon

    TypeScript

Backend & Data Services

  • icon

    Node.js

  • icon

    Python

  • icon

    .NET

Databases

  • icon

    PostgreSQL

  • icon

    MySQL

  • icon

    MongoDB

  • icon

    Existing SQL databases

  • icon

    Custom reporting databases

Cloud & Infrastructure

  • icon

    AWS

  • icon

    Microsoft Azure

  • icon

    Google Cloud

  • icon

    Docker

Reporting Across the Systems Your Business Already Uses

Operational reporting often requires information from several platforms rather than one isolated source.

ERP / Business Systems

  • icon

    Microsoft Dynamics

  • icon

    NetSuite

  • icon

    Odoo

  • icon

    QuickBooks

  • icon

    Custom ERP platforms

CRM

  • icon

    Salesforce

  • icon

    HubSpot

  • icon

    Existing CRM environments

  • icon

    Custom customer-management systems

Operational Systems

  • icon

    Inventory systems

  • icon

    Order-management systems

  • icon

    Scheduling systems

  • icon

    Field-service systems

  • icon

    QMS

  • icon

    LIMS

  • icon

    Production-related systems

  • icon

    Internal applications

  • icon

    Customer portals

  • icon

    Custom databases

Files & Existing Reporting Sources

  • icon

    Excel / spreadsheets

  • icon

    CSV exports

  • icon

    Shared reporting files

  • icon

    Existing databases

  • icon

    Legacy reporting environments

What Good Operational Reporting Should Make Clear

Every dashboard does not need every metric. Reporting should help users answer a small number of important operational questions quickly and reliably.

What Is Happening?

Show current workload, status, volume, performance, and operational position.

What Changed?

Show trends, movement, variance, and meaningful differences from previous periods or expected performance.

What Needs Attention?

Surface exceptions, delays, thresholds, backlog, aging, missing information, and unresolved work.

What Can I Investigate?

Allow users to drill from summary information into the records, workflow stages, systems, or underlying data supporting the result.

Consistent KPIs Before More Dashboards

A dashboard cannot create reliable management information if teams do not agree on what the measures mean.

KPI Definition

Define exactly what each KPI measures and why it matters.

Data Source

Identify which system or dataset provides the authoritative information.

Calculation Logic

Document how the KPI is calculated, filtered, grouped, and refreshed.

Ownership

Define who is responsible for reviewing the measure and what action may follow.

Security & Access Within Reporting

Operational dashboards can contain sensitive business, customer, employee, financial, operational, or regulated information. Access and data-handling requirements should be incorporated into reporting design.

Role-Based Access

  • icon

    User roles

  • icon

    Department views

  • icon

    Site-specific views

  • icon

    Management permissions

Data Access

  • icon

    Approved source systems

  • icon

    Required fields

  • icon

    Database permissions

  • icon

    Data restrictions

Reporting Environment

  • icon

    Authentication

  • icon

    Dashboard permissions

  • icon

    Sharing controls

  • icon

    Environment configuration

Monitoring & Ownership

  • icon

    Data-refresh visibility

  • icon

    Failed-refresh handling

  • icon

    Report ownership

  • icon

    Access review where required

Security & Access

Reporting access should reflect the users, information, source systems, and responsibilities involved in the reporting environment.

View Security, Privacy & Delivery Assurance

Operational Reporting Across Different Environments

Reporting requirements differ according to the workflows, systems, decisions, users, and operating pressures involved.

Health and life sciences operational reporting

Health & Life Sciences

Improve visibility into workflow status, inventory, quality-related handoffs, supply activity, operational performance, exceptions, backlog, and management reporting across process-driven teams.

Explore Health & Life Sciences
Ecommerce and distribution reporting

Ecommerce & Distribution

Bring together order, inventory, fulfillment, returns, marketplace, customer, warehouse, finance, and operational information into clearer reporting and exception visibility.

Explore Ecommerce
Facilities and field services reporting

Facilities & Field Services

Report on work orders, scheduling, technician activity, completion, backlog, service levels, site activity, customer workflows, and field-to-office performance.

Explore Facilities & Field Services
Manufacturing operational reporting

Manufacturing

Improve visibility into production-related workflows, inventory, materials, maintenance, quality information, backlog, exceptions, and operational performance across plant and management teams.

Explore Manufacturing

How Operational Reporting Implementation Works

How an Operational Reporting Engagement Works

We start by understanding the decisions teams need to make, what information they rely on, where that data comes from, and why current reporting may not provide enough clarity.

1

Operations Fit Call

We discuss your reporting workflows, KPIs, data sources, business systems, spreadsheets, manual preparation, leadership needs, exceptions, and the decisions current reports are expected to support.

2

Engagement Scope

We review how information is collected and used, then define whether the need is reporting improvement, data alignment, workflow redesign, dashboard implementation, integration, or both, including trusted sources and ownership.

3

Advisory, Implementation, or Both

Based on the agreed need, we support reporting redesign, KPI alignment, data connections, dashboards, exception views, automated reporting, operational visibility, and decision-support capabilities.

30-minute call

No obligation

Consulting and implementation scoped separately

Selected Case Studies

Real outcomes from our operations consulting and implementation engagements.

Loading case studies...

Watch Our Solutions in Action

Supply chain command center dashboard preview

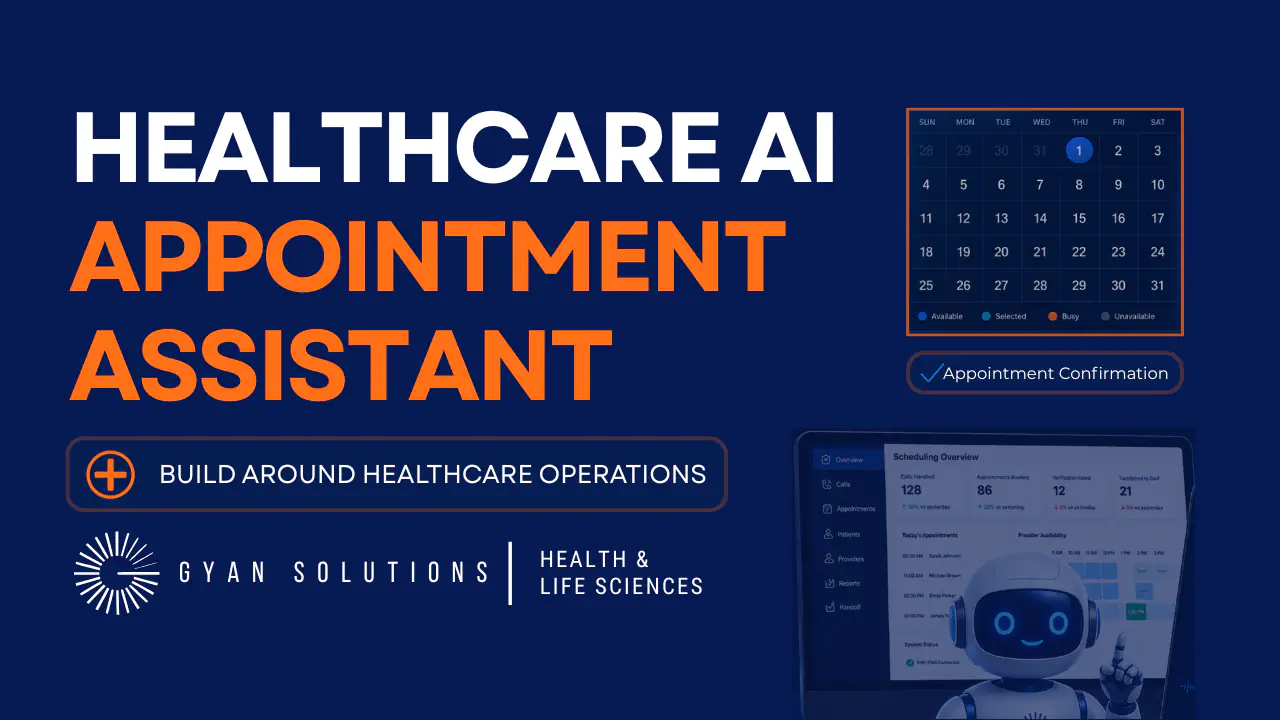
AI Appointment Scheduling Assistant for Clinic Operations

See how Gyan Solutions Health & Life Sciences experts designed an AI-enabled scheduling workflow around patient verification, provider availability, EHR/PMS updates, confirmation steps, and safe staff handoff.

  • Check iconVerify patients before system changes
  • Check iconCheck provider availability and scheduling rules
  • Check iconSend confirmation details after booking
  • Check iconTransfer safely when human review is needed
Order to cash automation dashboard preview

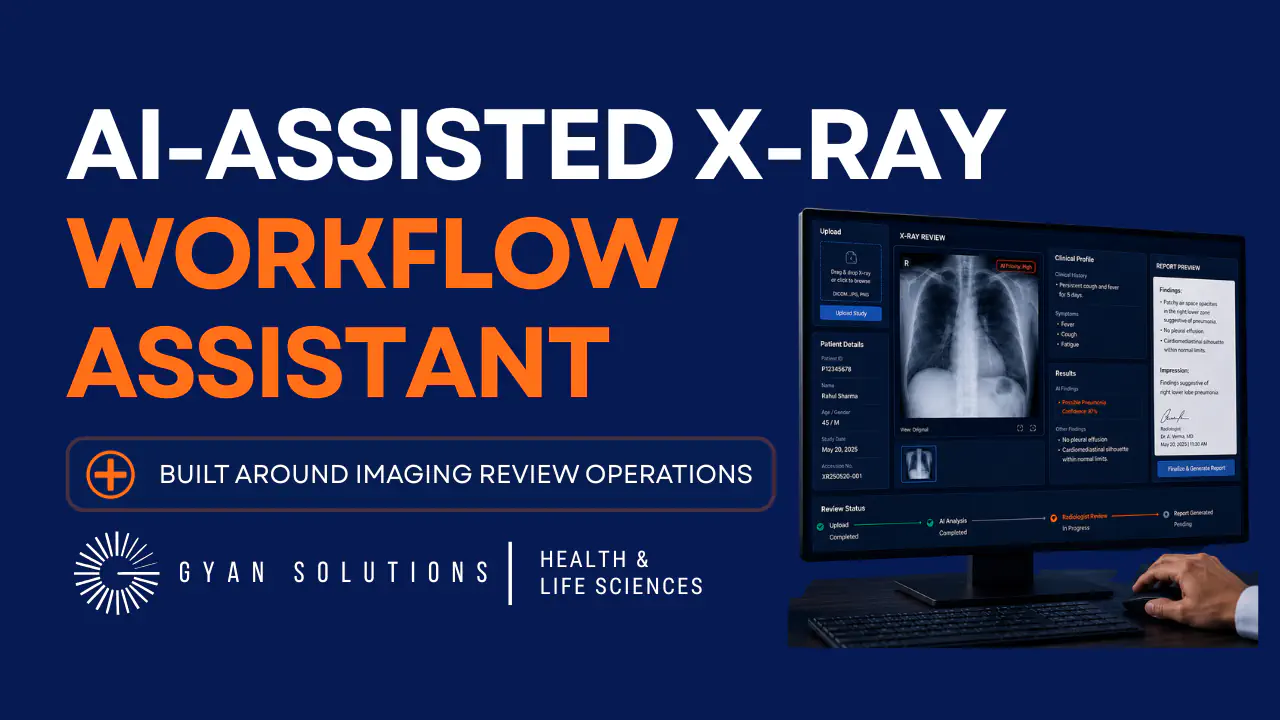
X-Ray Review Workflow Assistant for Imaging Operations

See how Gyan Solutions Health & Life Sciences experts designed an AI-assisted X-ray workflow around image upload, patient context, clinical information, human-initiated review, results support, and structured reviewer handoff.

  • Check iconConnect image, patient details, and clinical context in one workspace
  • Check iconStart AI-assisted review only when the case is ready
  • Check iconSeparate model output from final clinical interpretation
  • Check iconSupport clearer reviewer handoffs with labs, notes, and treatment context

What Clients Say

Real outcomes from operations consulting and implementation work that drives clarity, efficiency, and measurable business impact.

Dr. Jason Jawanda
Dr. Jason Jawanda

Dr. Jason Jawanda

Director

Gyan Solutions understood that we needed more than a standard booking tool. They translated our clinic’s scheduling requirements into an AI-assisted operator that could support appointment inquiries, booking, and staff handoffs while keeping our team in control of the process.

★★★★★
5.0 out of 5
Adrien Kabamba
Adrien Kabamba

Adrien Kabamba

Director of Quality at Pharma PPI

Gyan Solutions brought a structured and practical approach to our work. They understood the importance of clear processes, defined accountability, and solutions that could operate effectively within a quality-focused pharmaceutical environment.

★★★★★
5.0 out of 5

Clinical-Stage Biotechnology Company

Executive Director, CMC

Gyan Solutions brought structure and visibility to a complex clinical-stage development program. They took the time to understand the dependencies across CMC, Quality, Clinical Operations, supply, and external partners, then established a practical framework that improved ownership, coordination, and decision-making without disrupting our existing systems.

★★★★★
5.0 out of 5

When the Numbers Exist but the Answer Still Isn't Clear

Find where fragmented reporting, delayed information, disconnected systems, and unclear ownership are making operational decisions harder than they need to be.

Request a Free Operations Fit Call
Operations consulting meeting
icon

30-minute call

icon

No obligation

icon

Consulting and implementation scoped separately

Common Questions

What is operational reporting?

Operational reporting provides teams and managers with information about current workflows, performance, workload, status, exceptions, and business activity.It is designed to support day-to-day and management decisions rather than only historical financial reporting.

What is the difference between a dashboard and a report?

A dashboard usually provides a more visual and interactive view of current or summarized information.A report may provide more detailed, structured, scheduled, or record-level information.Many operational environments benefit from both.

Can Gyan build dashboards using our existing systems?

Yes.Dashboards and reporting can often be built around existing ERP, CRM, databases, spreadsheets, applications, and other operational systems without replacing those systems.

Which BI tools do you work with?

Depending on the requirement, Gyan can work with tools including Power BI, Tableau, Metabase, and custom reporting applications.The technology should be selected around the users, data environment, reporting requirement, maintainability, and existing systems.

Can reporting combine data from multiple systems?

Yes.Reporting can combine information from ERP, CRM, databases, spreadsheets, operational applications, ecommerce, QMS, LIMS, and other systems where the required technical access is available.Contextual Link Explore Systems Integration & Data Alignment →https://www.gyan.solutions/systems-integration-and-data-alignment/

Can you automate recurring reports?

Yes.Recurring reports, refresh workflows, distribution, alerts, and other reporting activities can often be automated.Contextual LinkExplore Business Automation →https://www.gyan.solutions/business-automation/

Can dashboards show exceptions instead of only KPIs?

Yes.Operational dashboards can be designed to surface exceptions such as:overdue work;backlog;missed thresholds;incomplete records;unexpected status;aging items;unresolved tasks;other conditions requiring attention.

Can users drill into the data behind a KPI?

Where appropriate, yes.Dashboards can be designed so users move from a summary KPI into supporting records, workflow stages, categories, locations, teams, or other underlying information.

Can different users see different dashboards?

Yes.Executives, managers, supervisors, field teams, and other users may require different reporting views.Role-based reporting can present relevant information according to responsibilities and permissions.

Can AI be added to operational reporting?

Yes, where there is a defined use case.AI can assist with summarization, natural-language querying, trend explanation, exception review, or management briefing support around approved reporting data.Contextual LinkExplore AI Development for Operational Decision Support →https://www.gyan.solutions/ai-development-for-operational-decision-support/

Can you improve dashboards we already have?

Yes.Existing dashboards can be reviewed for KPI clarity, data quality, usability, refresh performance, information hierarchy, exception visibility, role-based views, and alignment with management decisions.

Do we need an Operational Review before reporting implementation?

Not always.If the KPIs, data sources, users, reporting requirements, and expected outcomes are already clearly defined, implementation can be scoped directly.When teams know they lack visibility but are not certain what should be measured or why current reporting is not working, an Operational Review can help define the right reporting model first.

Let's Connect

Request a Free Operations Fit Call

Tell us where reporting, dashboards, KPIs, spreadsheets, data, or visibility are creating friction. We'll schedule a 30-minute Operations Fit Call to understand the current reporting environment and help determine the appropriate next step.

30-minute call

Focused on your goals

No obligation

You decide the next step.

Consulting & implementation

Consulting & implementation

Your information is secure and never shared.