


Dashboards Don’t Match Operational Reality
- Dashboards are regarded as the main pillar to decision-making in any company, which provides an overview of the heartbeat of business in the forms of numbers and graphs. Nevertheless, dashboards fail to represent the entire picture even with their value. They provide data, which appears right at first sight but many times, does not correspond with the realities of work performance.
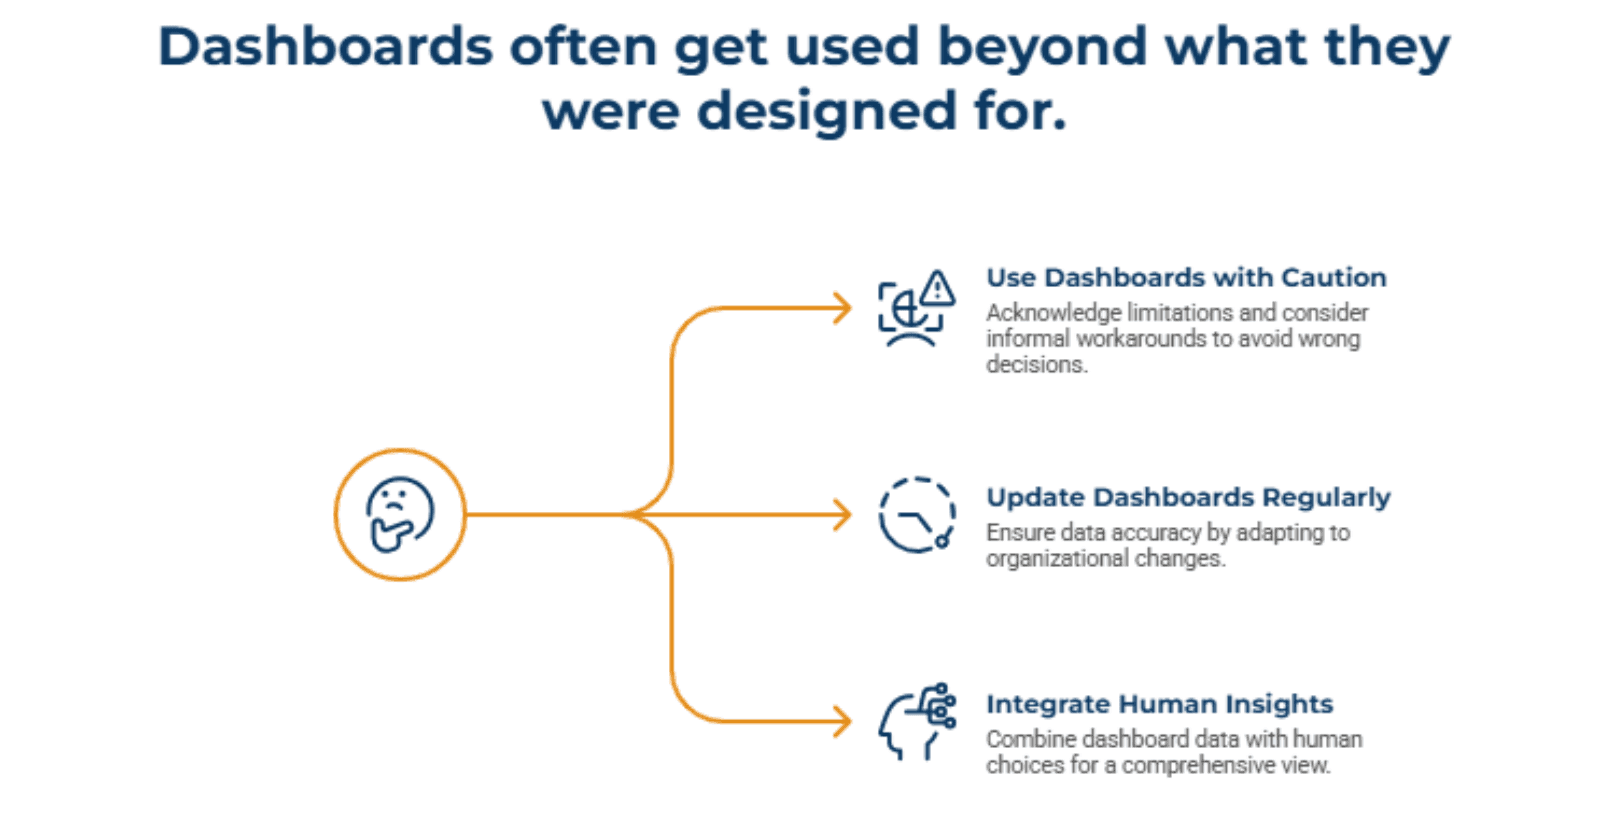
- With the changing and modifications of the organizations, even the representation which was previously true to the business picture can become obsolete very fast. Dashboards frequently lack the informal workarounds, tweaking and human choices that make the operations. The mismatch between what is shown on the screen and what is going on the ground can result in expensive wrong moves and wrong decisions.
When Numbers Look Right but Decisions Feel Wrong
Consider the case of a sales team performing well in the previous quarter by selling at whatever number was set but the pressure of reaching the target is showing up on the team. Apparently, the figures appear ideal, yet this is not what is happening on the ground as employees are working overtime, corners being cut and quality being compromised to achieve KPIs.
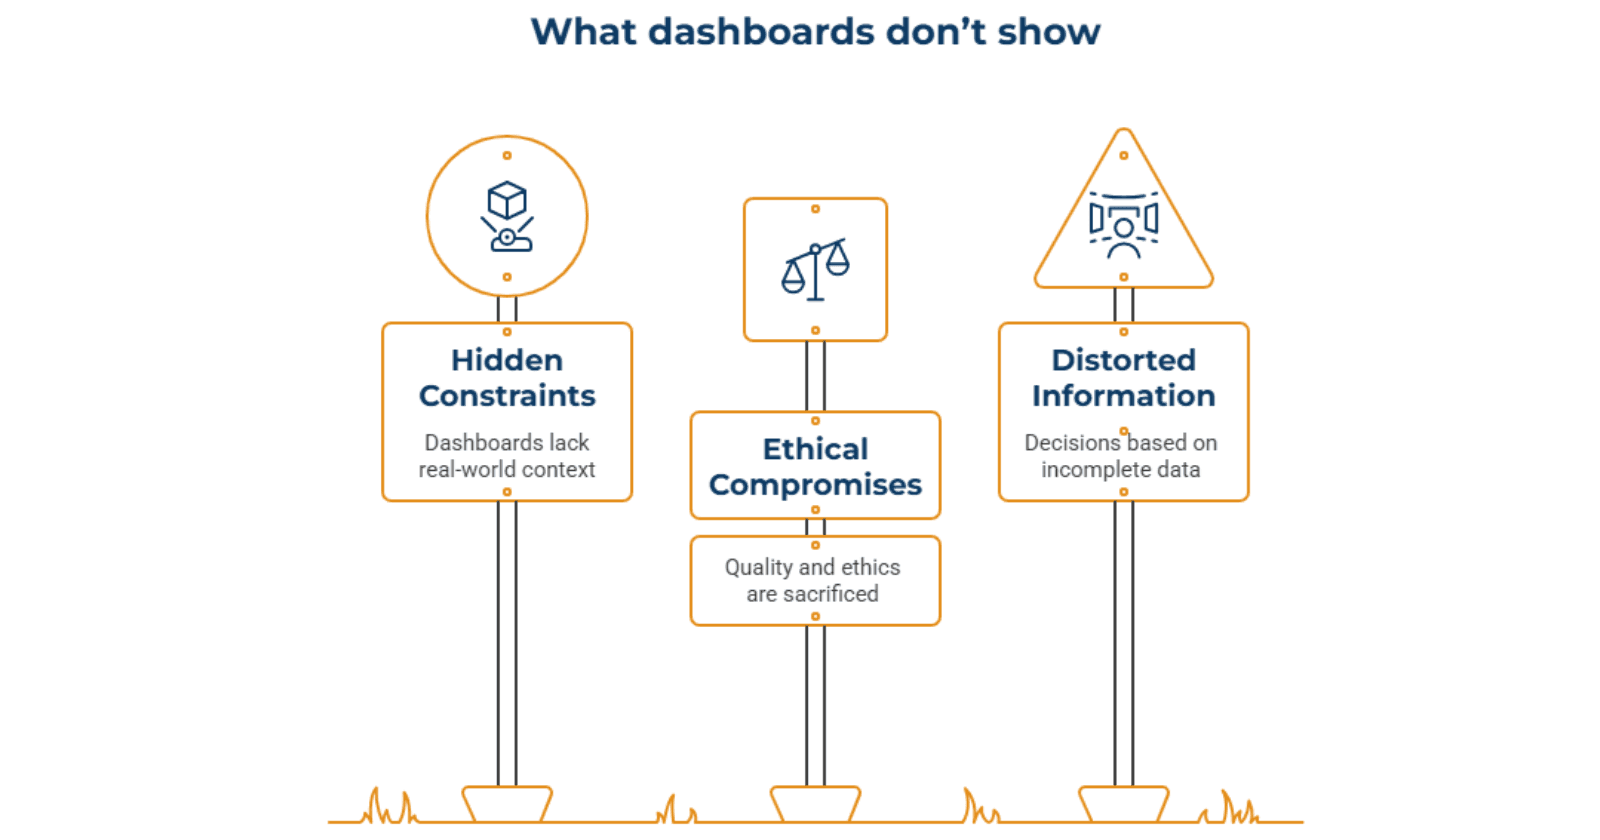
This disconnect occurs when the dashboards do not reflect the real constraints that the team is undergoing. It may be reflected in a report that all the sales targets are achieved but the internal struggle and ethical compromises to achieve it are not disclosed. This distortion results in the making of decisions that are made using incomplete or deceptive information.
What Dashboards Miss About Real Work
- Although dashboards are central to critical metrics data, their evaluations tend to ignore the unobvious elements that affect the day-to-day operations. A production team may achieve its production goal, but what it cannot display in the dashboard is that there is a continuous rearrangement of workflows by employees and working overtime to satisfy the deadlines. These unofficial tactics are the actual business that is on the move.
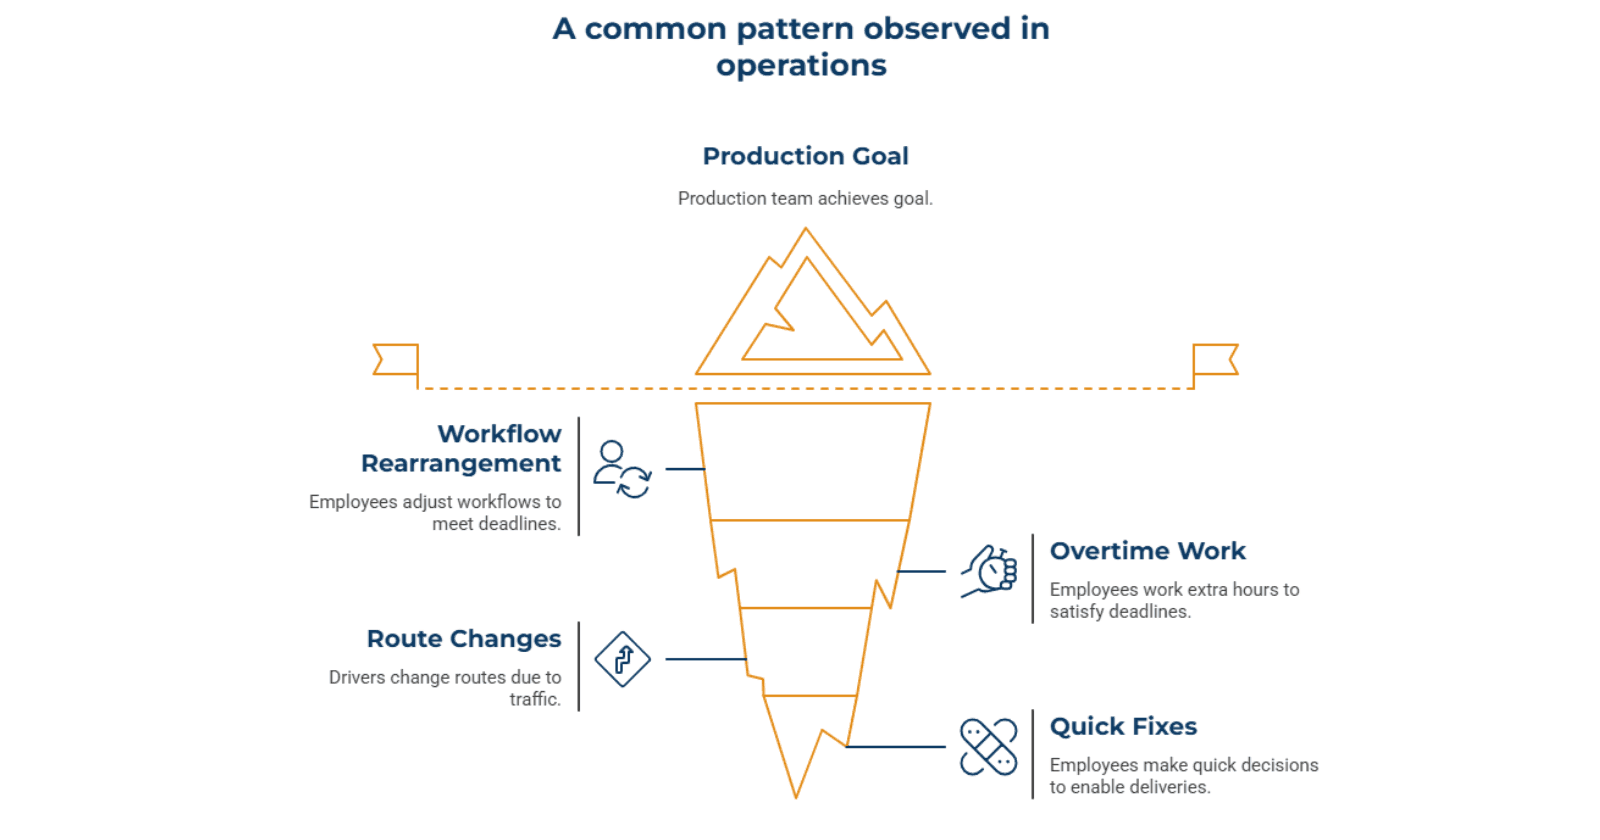
- To take the case of a certain logistics company, the company was getting its drivers to meet their delivery time schedule although they were changing their routes improvidently since there were unexpected traffic or customer emergencies. The dashboard merely followed on-time deliveries but not the back and forth decision and quick fixes, which enabled those deliveries.
Why More Metrics Don’t Create More Clarity
With each metric incorporated on a dashboard, the less apparent the image is. Incorporating such measures as response time and inventory turnover in one company led to a lack of clarity as opposed to clarity. The data had to be sifted through, instead of complementing the decisions of managers and thus complicated the identification of the root causes of inefficiencies.
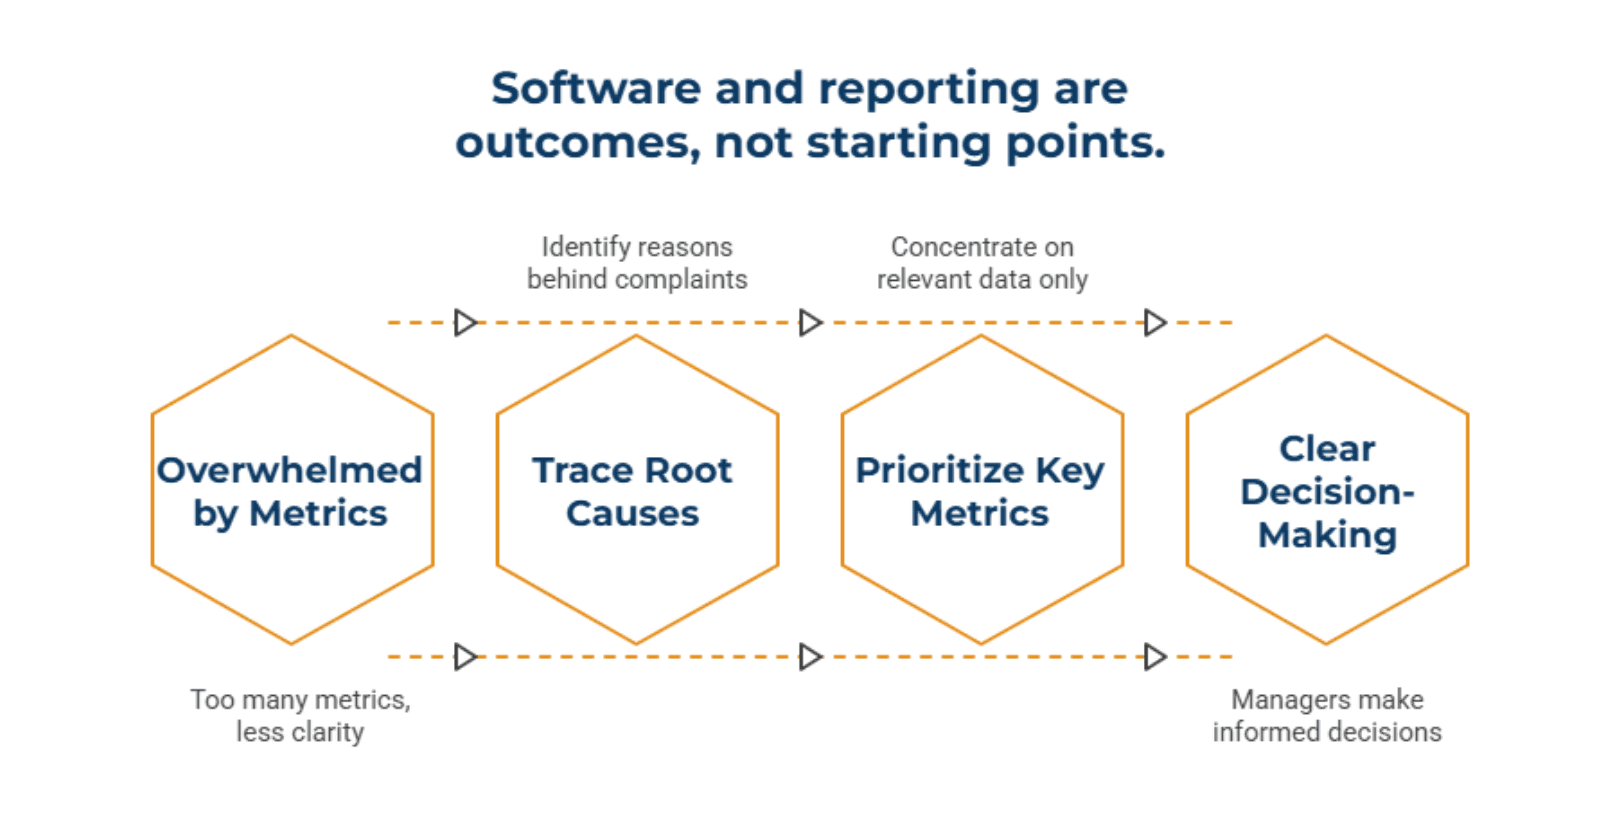
The issue is not with the amount of measures- it is their applicability. As an example, once a company began tracing customer complaints, they lost the reason why the complaints were being made; lack of communication among departments. It is also possible that by adding additional metrics, it is more difficult to see the real problems and make teams concentrate on the wrong data.
Where Operational Reality Gets Lost
- Dashboards tend to concentrate on the result and productivity but overlook the background on the means of achieving the results. An example to illustrate is that a service team may claim high customer satisfaction ratings, however, such ratings are attained by employees going out of their normal job descriptions, making personal sacrifices or utilizing old resources not reflected in the system.
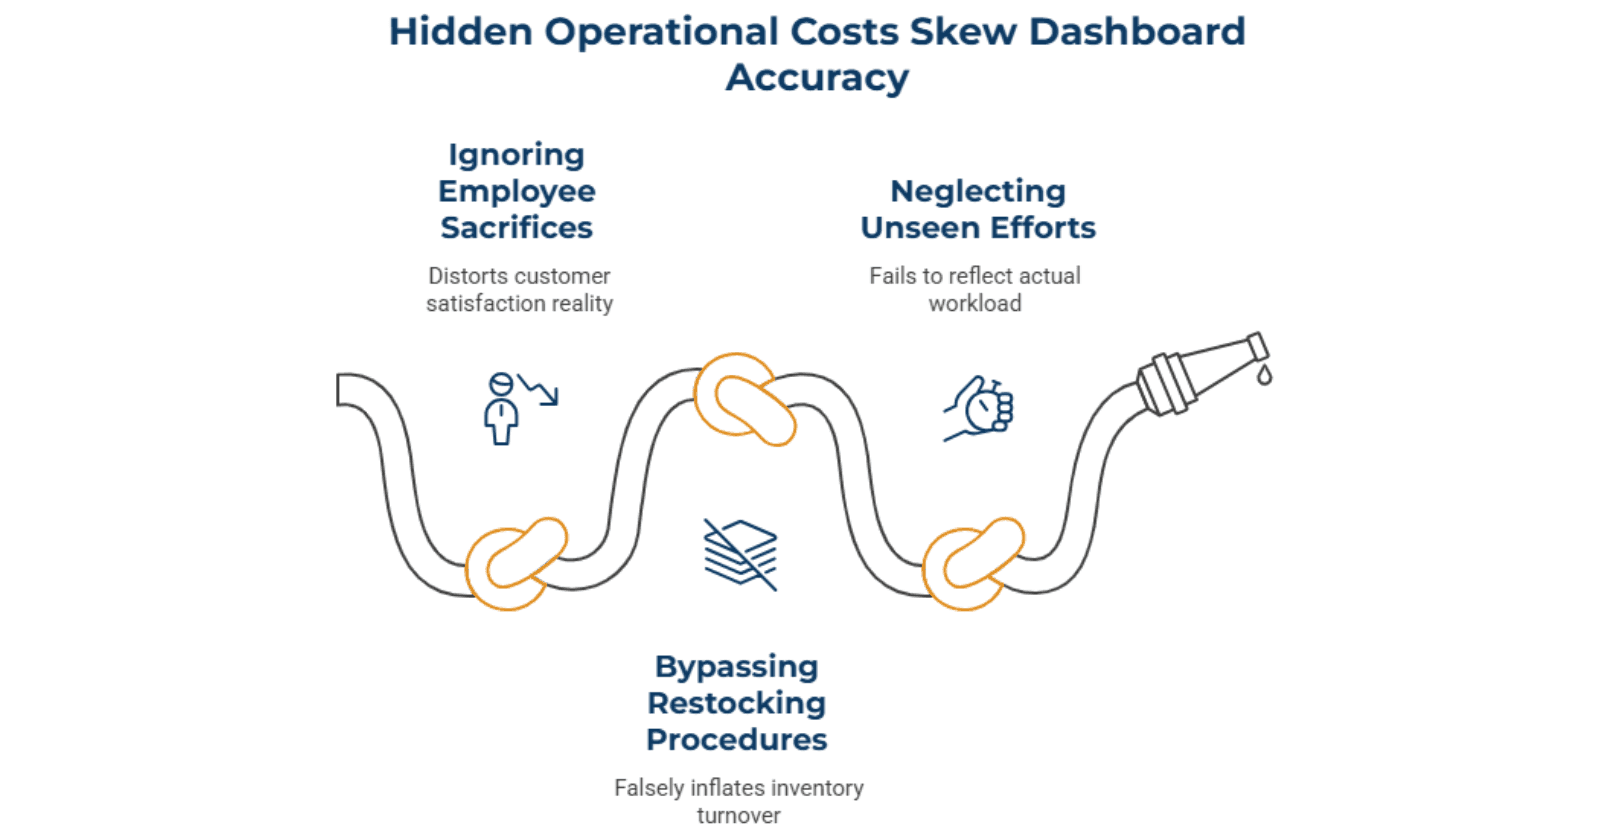
- A real world example would be a retail store that has had high inventory turnover but the truth is that the employees are not following essential steps in restocking to ensure the shelves appear stocked to customers. These non-formal adjustments are an important element of the reality of operations, yet the dashboards do not consider the time and effort put into the figures, to make them look perfect.
Clarity Comes Before Better Reporting
- Most businesses have the tendency to believe that the misalignment issue will be resolved by engaging in improved reporting or additional metrics. Nevertheless, the first step is to be clear on what is happening on the ground.
- It is only when the decision-makers are aware of the entire extent of operations that they can come up with dashboards that are representative of the actual business situation. This is why systems integration and data alignment become essential, as clarity comes before better reporting and before any meaningful improvement in how performance is represented.
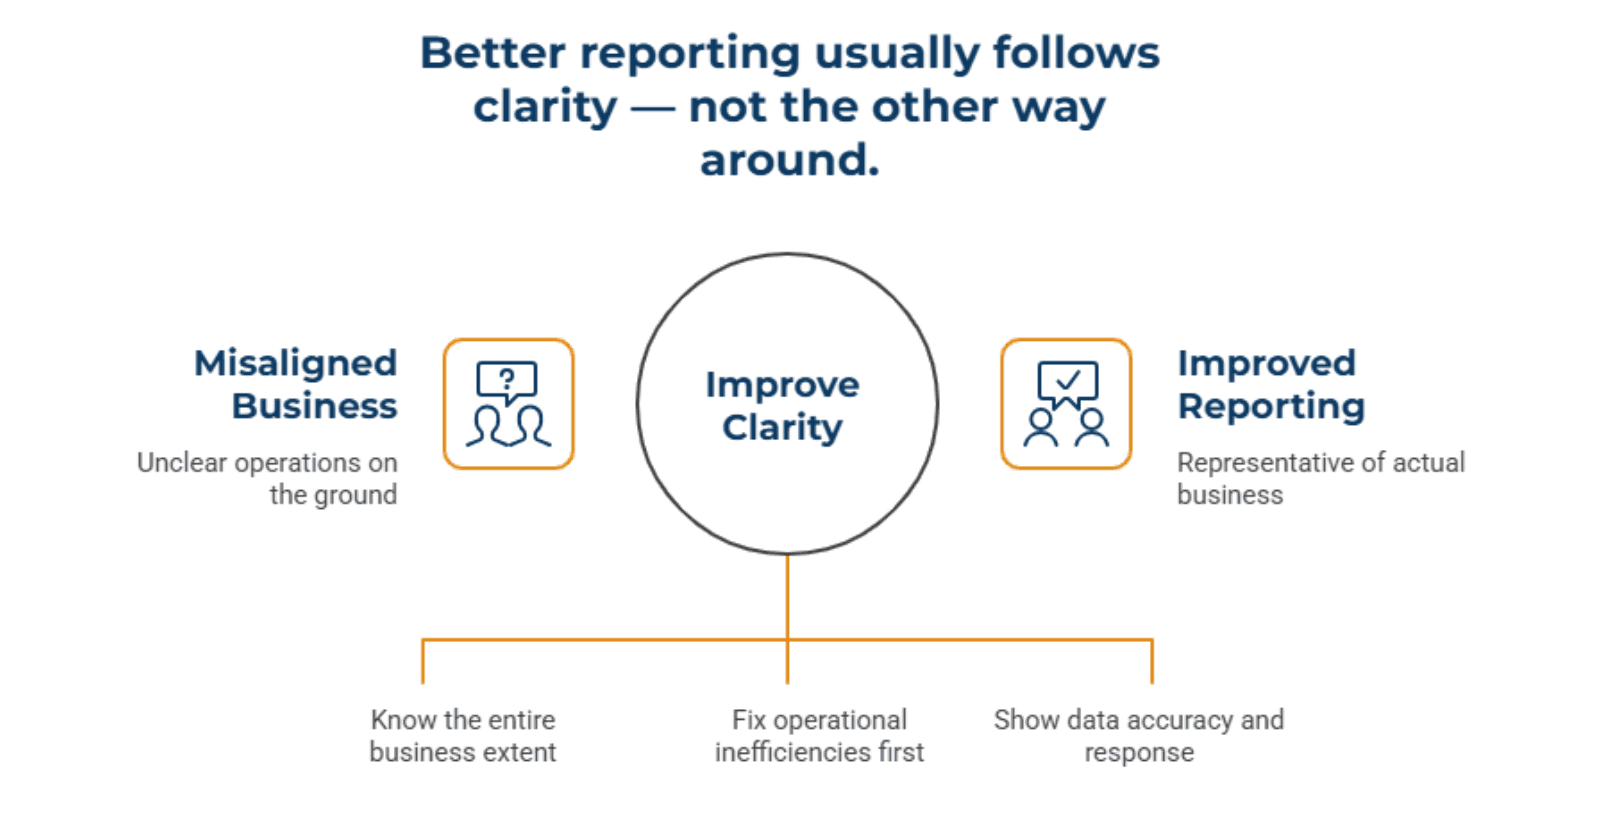
- As an example, when one company realized that their customer service team was wasting hours in trying to figure out how to resolve the problems brought about by the old information in the system they could realign the dashboard to show not only response time, but also the data accuracy. The issue of reporting did not improve until the loopholes in its operations were comprehended and resolved.
Conclusion
- When dashboards fail to reflect operational reality, the problem is often not the data itself, but outdated assumptions about how work is done. As business operations evolve, so do the realities of work. Dashboards often fail to keep up with these changes, which can lead to discrepancies between reported metrics and actual performance.
2. The gap between what dashboards report and what’s happening on the ground is usually a sign that the system needs realignment. Sometimes this means adjusting the data being tracked, clarifying roles, or understanding informal processes. In many cases, it’s about removing assumptions and bringing operational reality into focus.
3. In some cases, system changes are necessary, but more often than not, better clarity about decision-making and workflow can resolve the misalignment. Improving dashboards without first understanding operational realities will only perpetuate the problem. Therefore, clarity should always come before better reporting, as it lays the foundation for more accurate and actionable insights.

PAUL LUCKI
I'm Paul Lucki, Head of Business Development at Gyan Solutions, specializing in business automation, ERP implementation, and operational reporting. I partner with C-suite leaders to diagnose coordination failures and design systems that align teams, data, and processes. I've helped organizations reduce operational delays by 30-40% through integrated systems and decision-support infrastructure. My expertise focuses on automating manual processes, developing ERP implementations that reflect operational reality, and building reporting systems that drive real decisions. I believe operational excellence begins with systems that reflect reality, not theory.



