

ECOMMERCE ANALYTICS DASHBOARD
Ecommerce Analytics Dashboards Built Around the Decisions Teams Need to Make
Gyan Solutions helps ecommerce and retail organizations turn data from customers, orders, inventory, fulfillment, channels, returns, service, and revenue into dashboards that support real operational and management decisions.
We define what needs to be measured, where the information comes from, how each KPI is calculated, and what users need to see before building the dashboard.
Choose the path that fits your current need for reporting clarity or defined implementation.
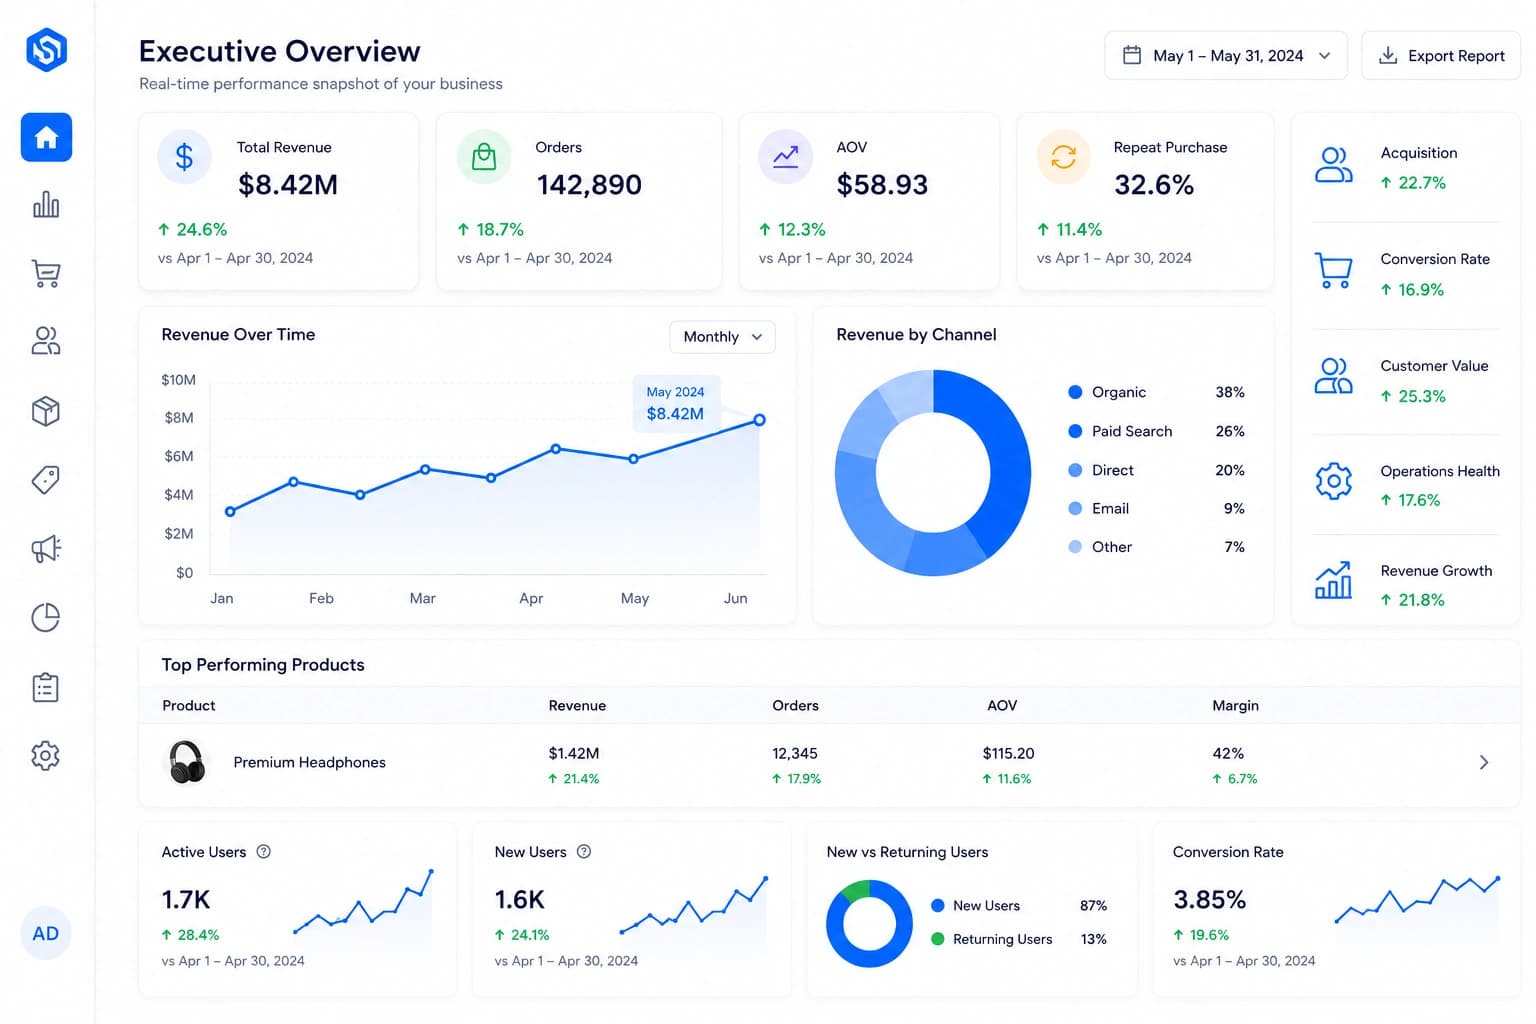
Connect sales, orders, discounts, refunds, customer activity, products, and channels around a clearer view of commercial performance.
Track order volume, backlog, delays, exceptions, fulfillment status, and operational performance.
See availability, stockouts, inventory movement, location performance, channel allocation, and replenishment signals.
Connect customer activity, returns, service demand, repeat contacts, and operational issues affecting the customer journey.
Ecommerce Dashboards Fail When the Numbers Are Visible but the Operation Is Not
A business may already have dashboards and still struggle to understand what requires attention.
The problem is often not the visualization itself. It is the way KPI definitions, source systems, data ownership, reporting logic, and operational context come together behind it.
Different Teams Report Different Numbers
Marketing, ecommerce, finance, inventory, operations, and customer service may calculate the same KPI differently or use different source systems.
Reporting Still Depends on Spreadsheets
Teams export data from several platforms, combine files manually, correct information, and rebuild reports before management can use them.
Dashboards Show Totals but Hide Exceptions
Leadership can see revenue, orders, or inventory but cannot easily see which products, locations, channels, orders, or workflows require action.
Important Information Arrives Too Late
Stockouts, fulfillment delays, return spikes, service backlogs, or channel problems may only become visible after customers or revenue have already been affected.
Teams Cannot Trace the Number Back to the Source
Users see a KPI but do not know which system owns it, what records are included, or how the calculation was produced.
More Dashboards Create More Reporting Complexity
Different tools and departments create separate views until management spends more time reconciling dashboards than using them.
Operational Clarity
Not sure whether the reporting problem comes from KPI definitions, source data, integration, workflow, or the dashboard itself?
A Dashboard Is the Last Step—not the First
The visible dashboard is only the final layer of the reporting process.
Reliable ecommerce reporting depends on understanding the business question, identifying the correct source information, aligning data across systems, defining the KPI, validating the calculation, and presenting the result in a way the user can act on.
That is why Gyan starts with the decision the dashboard needs to support rather than beginning with charts.
Key insight
The goal is not to show more data. The goal is to make the information required for a decision easier to see, understand, and act on.
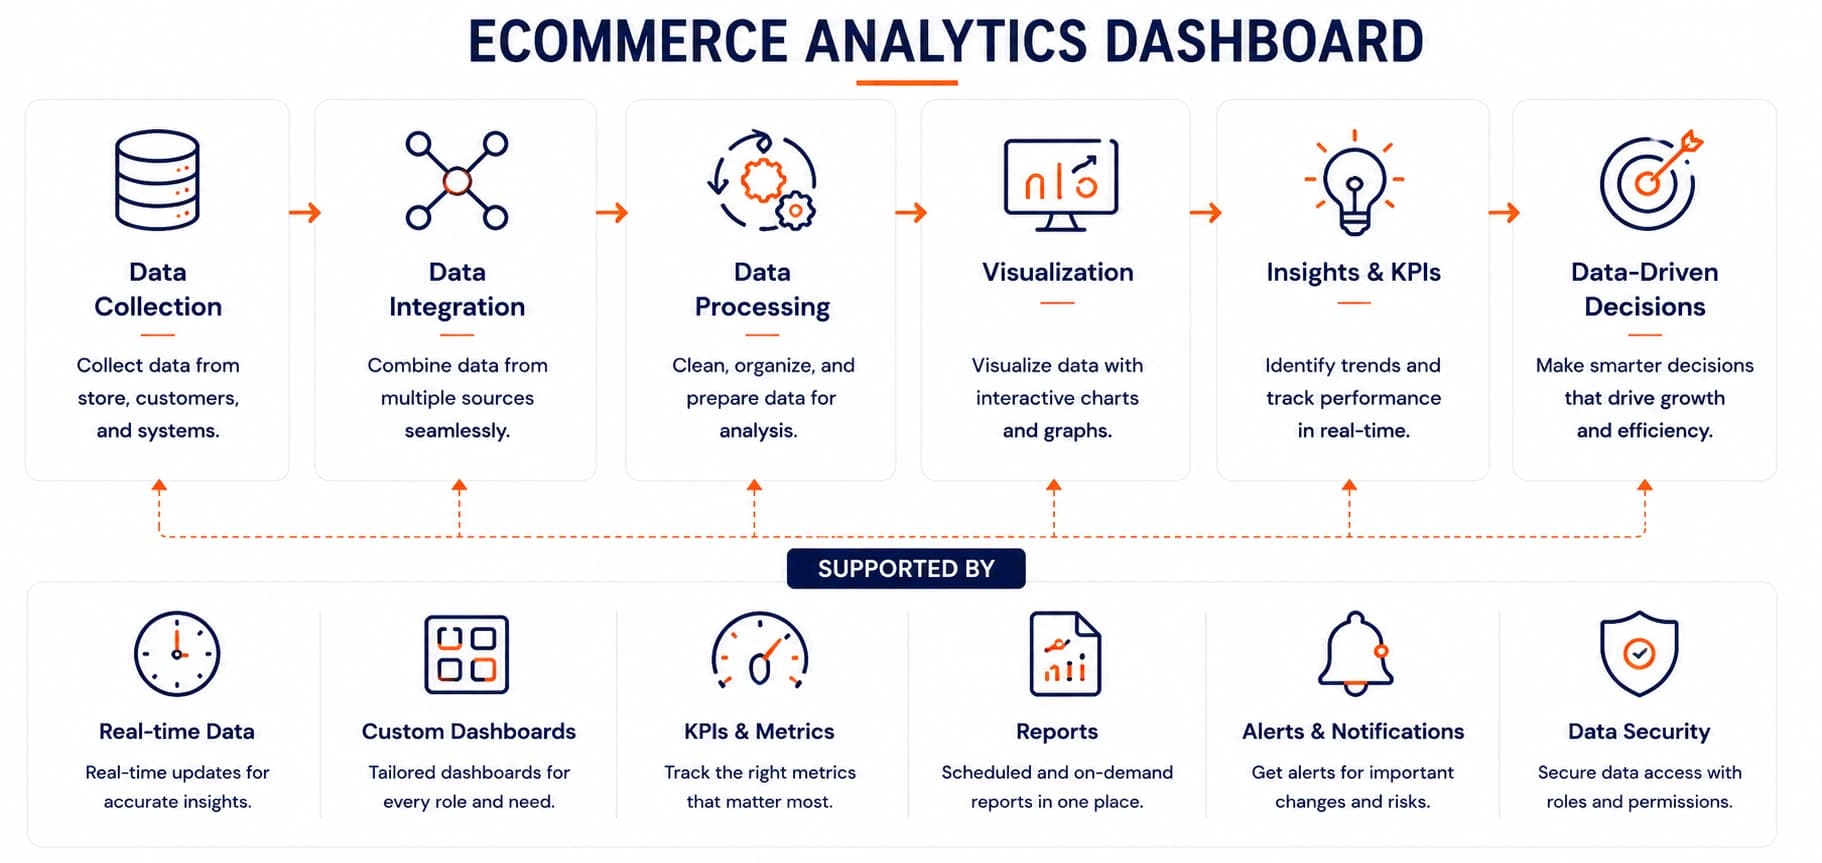
Business Question → Source Data → KPI Definition → Validation → Dashboard → Decision → Action
Two Focused Ways to Improve Ecommerce Reporting & Dashboards
Some organizations know reporting is unreliable or difficult but are not yet certain what the dashboard should measure. Others already have clearly defined reporting requirements and need implementation.
Operational Review & Improvement
For ecommerce teams that need clarity across KPIs, reporting, workflows, source systems, ownership, and management decisions before building or replacing dashboards.
 Map how revenue, customers, orders, inventory, fulfillment, returns, service, and channel information is currently reported.
- Identify inconsistent definitions, manual reporting, unreliable sources, missing operational context, and ownership gaps.
- Define which measures, exceptions, management views, and reporting cadences are actually required.

Operational Review & Improvement can stand alone from reporting assessment through KPI and management-reporting redesign.
Technology & AI Implementation
For ecommerce teams with defined requirements for dashboards, data models, management reporting, exception views, automated reports, or multi-system analytics.
- Turn the defined reporting requirement into a practical dashboard and data implementation plan.
- Connect information from ecommerce, ERP, CRM, OMS, WMS, marketplaces, inventory, customer service, databases, and other required sources.
- Build dashboards, reporting models, automated views, exception reporting, and supporting integrations around the agreed KPIs.
Technology & AI Implementation can begin independently or work alongside Operational Review & Improvement.
Ecommerce Analytics &
Dashboard Experience
Our ecommerce dashboard work is shaped by the decisions teams need to make across revenue, customers, orders, inventory, fulfillment, returns, service, channels, and operational performance.
We examine how ecommerce platforms, ERP, CRM, OMS, WMS, POS, marketplaces, databases, customer-service systems, spreadsheets, and reporting tools produce the information behind those decisions.
This reveals where KPI definitions, source data, ownership, integration, reporting logic, or focused dashboard implementation need to improve.
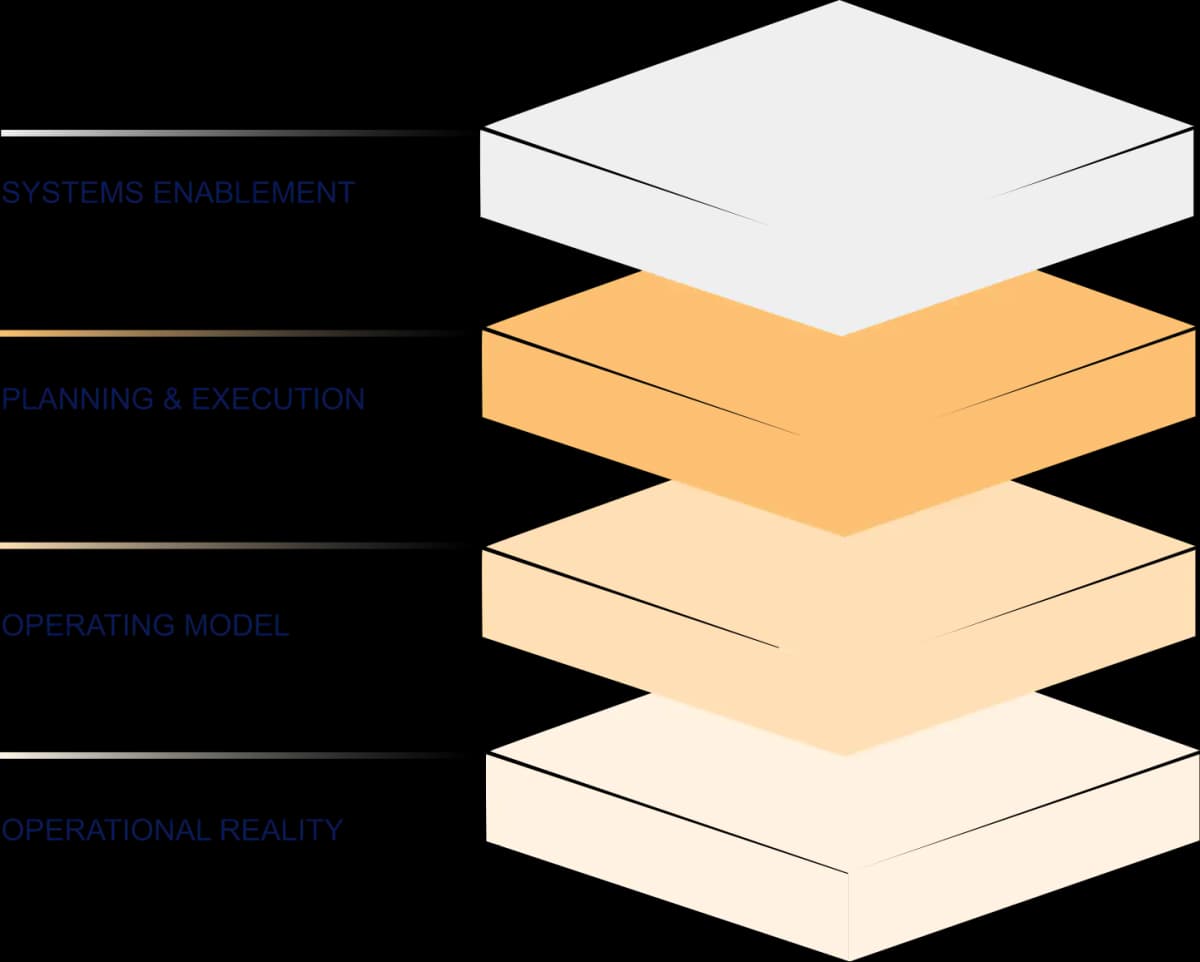
Where Ecommerce Dashboard Performance Becomes Connected
We focus on the parts of ecommerce reporting where commercial performance, operational execution, customer outcomes, and management decisions depend on the same underlying information.
Executive & Revenue Performance
Leadership needs a view of ecommerce performance that connects commercial results with the operation producing them. Revenue alone may not explain whether orders, discounts, cancellations, returns, inventory constraints, or fulfillment issues are affecting performance.
What We Examine
- Gross and net sales
- Order volume
- Average order value
- Discounts and promotions
- Cancellations
- Returns and refunds
- Product and category performance
- Customer mix
- Channel performance
- Target vs actual
- Period comparisons
- Operational context behind revenue changes
Desired Outcome
Give leadership a clearer view of commercial performance and the operational conditions influencing the result.
Conversion & Customer Performance
Customer and conversion reporting should connect digital activity with actual orders and customer outcomes. Traffic and conversion metrics are more useful when they can be understood alongside products, customers, availability, orders, and repeat purchasing.
What We Examine
- Traffic and sessions
- Conversion
- Cart and checkout performance
- New vs repeat customers
- Average order value
- Customer segments
- Purchase frequency
- Repeat purchase
- Product conversion
- Channel or source information
- Customer cohorts
- Order and revenue connection
Desired Outcome
Connect customer and conversion activity with real commercial outcomes instead of measuring website behavior in isolation.
Order Management
Order reporting should show how work is moving through the operation, not simply how many orders were created.
What We Examine
- Orders received
- Orders validated
- Orders released
- Open orders
- Order backlog
- Order holds
- Delayed orders
- Backorders
- Partial orders
- Cancellations
- Order exceptions
- Order cycle time
Desired Outcome
Give teams a clearer view of order flow, backlog, delays, and exceptions requiring operational attention.
Inventory & Availability
Inventory dashboards need to distinguish between what physically exists and what can actually support customer demand.
What We Examine
- On-hand inventory
- Available-to-sell inventory
- Reserved inventory
- Committed inventory
- Inventory by location
- Inventory by channel
- Stockouts
- Backorders
- Low-stock exposure
- Receiving backlog
- Transfers
- Inventory adjustments
Desired Outcome
Improve visibility into where inventory is available, constrained, committed, or creating risk for customer orders.
Fulfillment Performance
Fulfillment reporting should help teams understand where accepted orders are slowing down or requiring intervention.
What We Examine
- Fulfillment backlog
- Order release time
- Picking time
- Packing time
- Shipment time
- Pickup readiness
- Delivery status
- Delayed orders
- Partial fulfillment
- Fulfillment exceptions
- Location performance
- Order completion time
Desired Outcome
Make fulfillment bottlenecks and execution problems easier to identify before they become larger customer-service issues.
Returns & Customer Service
Returns and service activity contain operational information that should not remain isolated inside support tools. Repeated complaints, return reasons, refund delays, and customer contacts may point toward problems with products, orders, fulfillment, or internal workflows.
What We Examine
- Return volume
- Return rate
- Return reasons
- Refund volume
- Refund processing time
- Service-contact volume
- Contact reasons
- Repeat contacts
- Resolution time
- Escalations
- Customer-service backlog
- Product, order, or fulfillment causes
Desired Outcome
Connect customer-service and return activity with the operational causes that may require attention.
Channel Performance
Different sales channels can produce different revenue, customer, inventory, return, and fulfillment requirements. A useful channel view needs consistent definitions so direct ecommerce, marketplaces, stores, B2B, and other channels can be compared meaningfully.
What We Examine
- Revenue by channel
- Orders by channel
- Average order value
- Customer mix
- Product mix
- Inventory use
- Returns
- Fulfillment performance
- Channel fees where available
- Exceptions
- Location or marketplace performance
- Comparable KPI definitions
Desired Outcome
Give management a consistent view of channel performance rather than relying on separate platform reports.
Exceptions & Operational Action
Dashboards become more useful when they help users see what requires action. The most important information may not be the average. It may be the individual order, product, location, customer case, integration, or workflow that has moved outside the expected condition.
What We Examine
- Stockouts
- Delayed orders
- Order holds
- Backorders
- Fulfillment delays
- Inventory discrepancies
- Failed integrations
- Unresolved customer cases
- Unusual return activity
- Missing data
- Threshold breaches
- Assigned ownership
Desired Outcome
Move reporting beyond observation by making operational exceptions and the required next action easier to identify.
Implement Around the Reporting Decisions the Business Needs
Technology should support a defined reporting requirement. Once the need is clear, Gyan can plan, build, connect, or improve the relevant analytics and dashboard environment.
Executive Dashboards
Build management views connecting revenue, orders, customers, inventory, fulfillment, returns, and operational performance.
Operational Dashboards
Give teams day-to-day visibility into backlog, exceptions, inventory, fulfillment, service, and workflow status.
Multi-System Reporting
Combine required information from ecommerce, ERP, CRM, OMS, WMS, POS, marketplaces, databases, and other operational systems.
KPI & Reporting Models
Create structured reporting logic so important measures are calculated consistently before reaching the dashboard.
Automated Reporting
Reduce recurring spreadsheet work through scheduled reporting, data preparation, alerts, and automated management views.
Exception & Decision-Support Views
Surface the products, orders, locations, customers, or workflows requiring attention instead of only showing aggregate performance.
Already Know What Needs to Be Measured?
Turn the dashboard requirement into a practical implementation plan.
AI Should Help Explain the Dashboard—not Replace Reliable Reporting
AI can help teams summarize changes, retrieve operational context, organize exceptions, and prepare management insights. Its value depends on trusted source data, clearly defined KPIs, reliable reporting logic, and appropriate access to the underlying information.
Management Summary Support
Prepare concise summaries of important changes across defined dashboard measures.
Exception Explanation
Help users investigate relevant orders, products, locations, customers, or operational events behind an unusual result.
Natural-Language Reporting
Allow approved users to ask defined business questions across structured reporting information where the architecture supports it.
Pattern & Trend Support
Assist with identifying unusual movement or recurring patterns that management may want to investigate further.
Operational Context Retrieval
Connect dashboard results with relevant records, reports, or approved operational information that helps explain the result.
Trust Statement
Before adding AI to ecommerce reporting, Gyan assesses the source data, KPI definitions, reporting logic, user permissions, decision boundary, and human review requirements.
When an Ecommerce Dashboard Fit Call Makes Sense
Use the call to clarify a reporting problem or discuss a defined dashboard implementation requirement.
When You Need Reporting Clarity
- Different teams report different numbers for the same KPI.
- Management reporting depends heavily on spreadsheets.
- Existing dashboards show activity but not operational causes.
- Reporting does not connect revenue with orders, inventory, fulfillment, returns, or service.
- Teams spend too much time preparing reports manually.
- Leadership knows visibility needs to improve but has not yet defined the right dashboard.
When the Requirement Is Clear
- An executive ecommerce dashboard is required.
- Order, inventory, fulfillment, or customer-service dashboards need to be implemented.
- Data from several systems needs to be combined into one reporting view.
- Existing dashboards need to be redesigned around clearer KPIs.
- Exception reporting or operational alerts are required.
- Automated management reporting needs to replace recurring spreadsheet work.
A Clear Starting Point Without a Forced Sequence
Start with Operational Review & Improvement, Technology & AI Implementation, or both based on how clearly the reporting requirement is already defined.
Ecommerce Dashboard Fit Call
We discuss the decisions your team needs to make, existing reports, KPIs, source systems, spreadsheets, reporting problems, users, and any dashboard requirement already identified.
Engagement Scope
We define whether the work should focus on Operational Review & Improvement, Technology & AI Implementation, or both. The required KPIs, users, source systems, reporting views, integrations, responsibilities, priorities, timeline, and delivery approach are agreed before work begins.
Review, Implementation, or Both
We deliver the agreed work—from KPI and reporting review through data alignment, dashboard implementation, automated reporting, integrations, exception views, testing, and rollout.
30-minute call
No obligation
Review and implementation scoped separately
Who This Is For
This service is designed for ecommerce and retail organizations where important commercial and operational information is spread across multiple systems, teams, locations, channels, or reporting processes.
Typical Environments
Ecommerce brands with meaningful transaction volume
Omnichannel retailers
Grocery and food ecommerce
B2B ecommerce and distribution
Multi-location retailers
Marketplace-driven businesses
Businesses using ERP, OMS, WMS, CRM, POS, or several operational systems
Teams relying heavily on spreadsheets for management reporting
Organizations with a defined BI or dashboard requirement
A Different Provider May Be Better If
You only need Google Analytics installed
You only need a prebuilt dashboard template
You only need a one-time spreadsheet report
You only need marketing attribution reporting
You only need accounting or financial-statement reporting
There is no defined management or operational decision the dashboard needs to support
Turn Ecommerce Data Into Useful Decisions
Clarify the KPIs, data sources, reporting gaps, exceptions, and views needed before building the dashboard.
Discuss Your Dashboard Requirement→

30-minute call

No obligation

Consulting and implementation scoped separately
Find the Right Ecommerce Operational Starting Point
A dashboard becomes useful only when the KPI, source data, and operational question behind it are clear. Explore the business area being measured or the integration supplying the information.
Explore by Operational Focus
Ecommerce Analytics & Reporting
Define KPI logic, authoritative sources, reporting ownership, reconciliation, and management requirements before deciding how the information should be visualized.
Ecommerce Conversion & Revenue Performance
Measure where traffic, buying intent, orders, cancellations, returns, and other operational factors change the revenue the business ultimately realizes.
Ecommerce Order Management
Surface order volume, backlog, status, cycle times, delays, routing, and exceptions when management needs clearer visibility into execution.
Inventory Management & Fulfillment
Track availability, stockouts, movement, replenishment, fulfillment, locations, and exceptions that influence customer promises and operational performance.
Explore by Technology & Integration
ERP & Ecommerce Integration
Bring ERP-managed orders, products, inventory, fulfillment, customers, finance, and transaction information into the reporting environment reliably.
Ecommerce Marketplace Integration
Connect marketplace orders, inventory, returns, fees, fulfillment, and channel activity with the broader performance picture management needs to see.
Ecommerce POS Integration
Add store sales, inventory, customers, returns, and location activity when online-only dashboards do not represent the full retail business.
Retail Software Development
Build specialized reporting applications, operational tools, or workflows where the required visibility extends beyond a standard dashboard.
Common Questions
What is an ecommerce analytics dashboard?
An ecommerce analytics dashboard brings selected customer, sales, order, inventory, fulfillment, channel, return, service, and other business information into a visual reporting environment designed around specific management or operational decisions.
What can an ecommerce dashboard include?
Depending on the requirement, dashboards may include revenue, orders, conversion, customers, products, inventory, backlog, fulfillment, returns, service activity, channel performance, operational exceptions, and other defined KPIs.
Can Gyan combine data from multiple ecommerce systems?
Yes, where the required technical access is available.Reporting can potentially combine information from ecommerce, ERP, CRM, OMS, WMS, POS, marketplaces, databases, customer-service systems, and other operational sources.
Can you build dashboards for inventory and fulfillment?
Yes.Dashboards can support inventory availability, stockouts, backorders, location-level inventory, fulfillment backlog, order-cycle time, delays, exceptions, and other operational measures.
Can you build executive ecommerce dashboards?
Yes.Executive dashboards can connect commercial and operational information around the measures leadership needs to monitor and review.
Can you automate ecommerce reporting?
Yes.Where source data and reporting requirements are defined, recurring reporting can potentially be automated through integrations, reporting models, scheduled refreshes, alerts, and management reports.
Which dashboard and BI tools can Gyan work with?
Depending on the environment and requirement, Gyan can work with platforms such as Power BI, Tableau, Metabase, custom reporting applications, databases, and existing BI environments.
Can AI be added to an ecommerce dashboard?
Yes, where there is a defined use case.AI may support management summaries, natural-language interaction, exception investigation, contextual retrieval, or analysis assistance. The underlying reporting data and KPI definitions still need to be reliable.
What is the difference between Ecommerce Analytics Dashboard and Ecommerce Analytics & Reporting?
Ecommerce Analytics Dashboard focuses on implementing dashboards, management views, KPI displays, exception reporting, and the technical reporting environment.Ecommerce Analytics & Reporting focuses more broadly on what should be measured, how KPIs are defined, which source data is authoritative, and what reporting the business needs
Do we need an Operational Review before dashboard development?
No.If the KPIs, users, data sources, reporting views, and desired outcome are already clearly defined, Gyan can move directly into Technology & AI Implementation.Operational Review & Improvement is used when the underlying reporting requirement still needs to be clarified.
Discuss Your Ecommerce Dashboard Requirement
Tell us which decisions, KPIs, reports, source systems, operational exceptions, or management views you need to improve. We'll use the initial conversation to understand the reporting environment, users, systems, data requirements, and whether the appropriate starting point is operational review, dashboard implementation, or a combination.
Focused on your goals
You decide the next step.
Consulting & implementation