

ECOMMERCE ANALYTICS & REPORTING
Turn Ecommerce Data Into Clearer Operational and Commercial Decisions
Ecommerce businesses generate data across storefronts, marketplaces, advertising, CRM, orders, inventory, fulfillment, customer service, returns, ERP, and finance.
The problem is rarely a lack of data. The problem is that teams cannot always connect that information into a reliable view of what is happening, why it is happening, and where action is required.
Gyan Solutions reviews the reporting environment, KPI definitions, source systems, data flows, and management decisions behind the reports—then helps create a clearer analytics and reporting model around the operation.
Review and implementation are scoped separately.
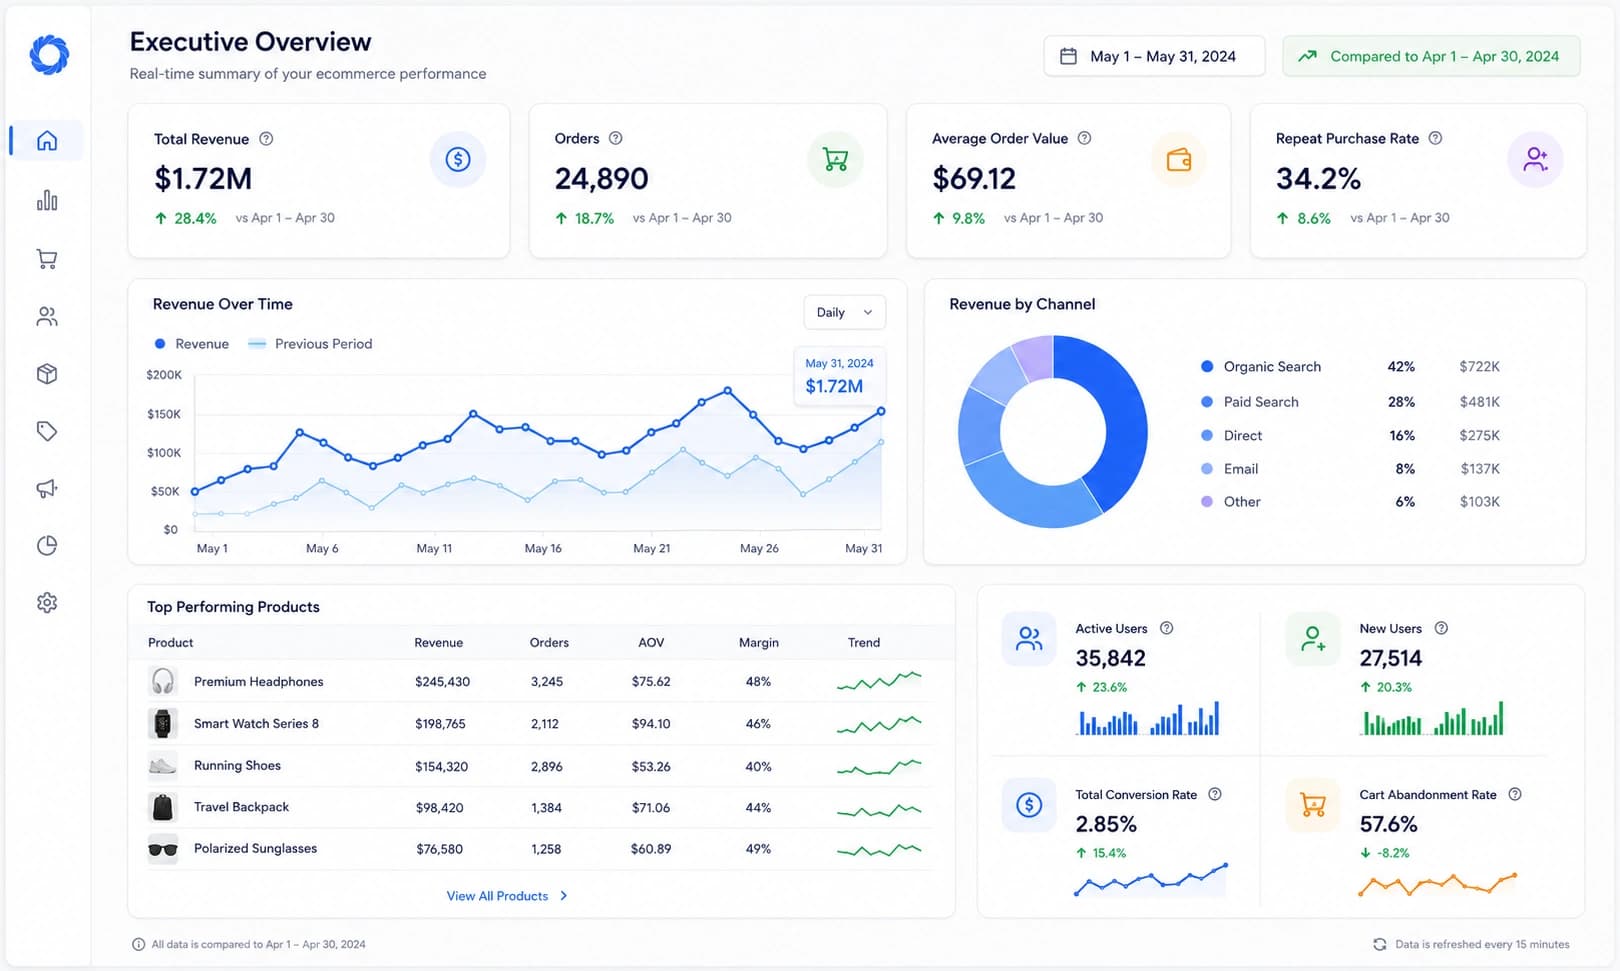
Teams rely on different sources or definitions, creating competing versions of revenue, inventory, customer, or operational performance.
Employees repeatedly export, clean, reconcile, and combine data before management can understand what is happening.
Dashboards show activity, but teams still struggle to see what changed, why it matters, or where action is required.
Stockouts, delays, returns, backlog, margin pressure, or channel issues become visible only after performance has already been affected.
Reporting Built Around the Decisions the Business Needs to Make
Operational & Commercial Perspective
We connect customer, order, inventory, fulfillment, channel, service, and financial information instead of treating each dashboard as a separate reporting project.
Source-to-Decision Review
We examine where a KPI originates, how it is calculated, who uses it, what decision it supports, and where the underlying data may be unreliable or incomplete.
Review Through Implementation
When improvement requires dashboards, data models, integrations, automated reporting, custom applications, or AI-assisted analysis, Gyan can support implementation after the reporting requirement is defined.
OPERATIONAL VISIBILITY
More Data Does Not Automatically Create Better Decisions
Ecommerce businesses generate information across storefronts, marketplaces, customers, orders, inventory, fulfillment, returns, service, ERP, and finance.
The challenge begins when those sources use different definitions, statuses, timing, or ownership leaving teams to reconcile the numbers before they can trust the story.
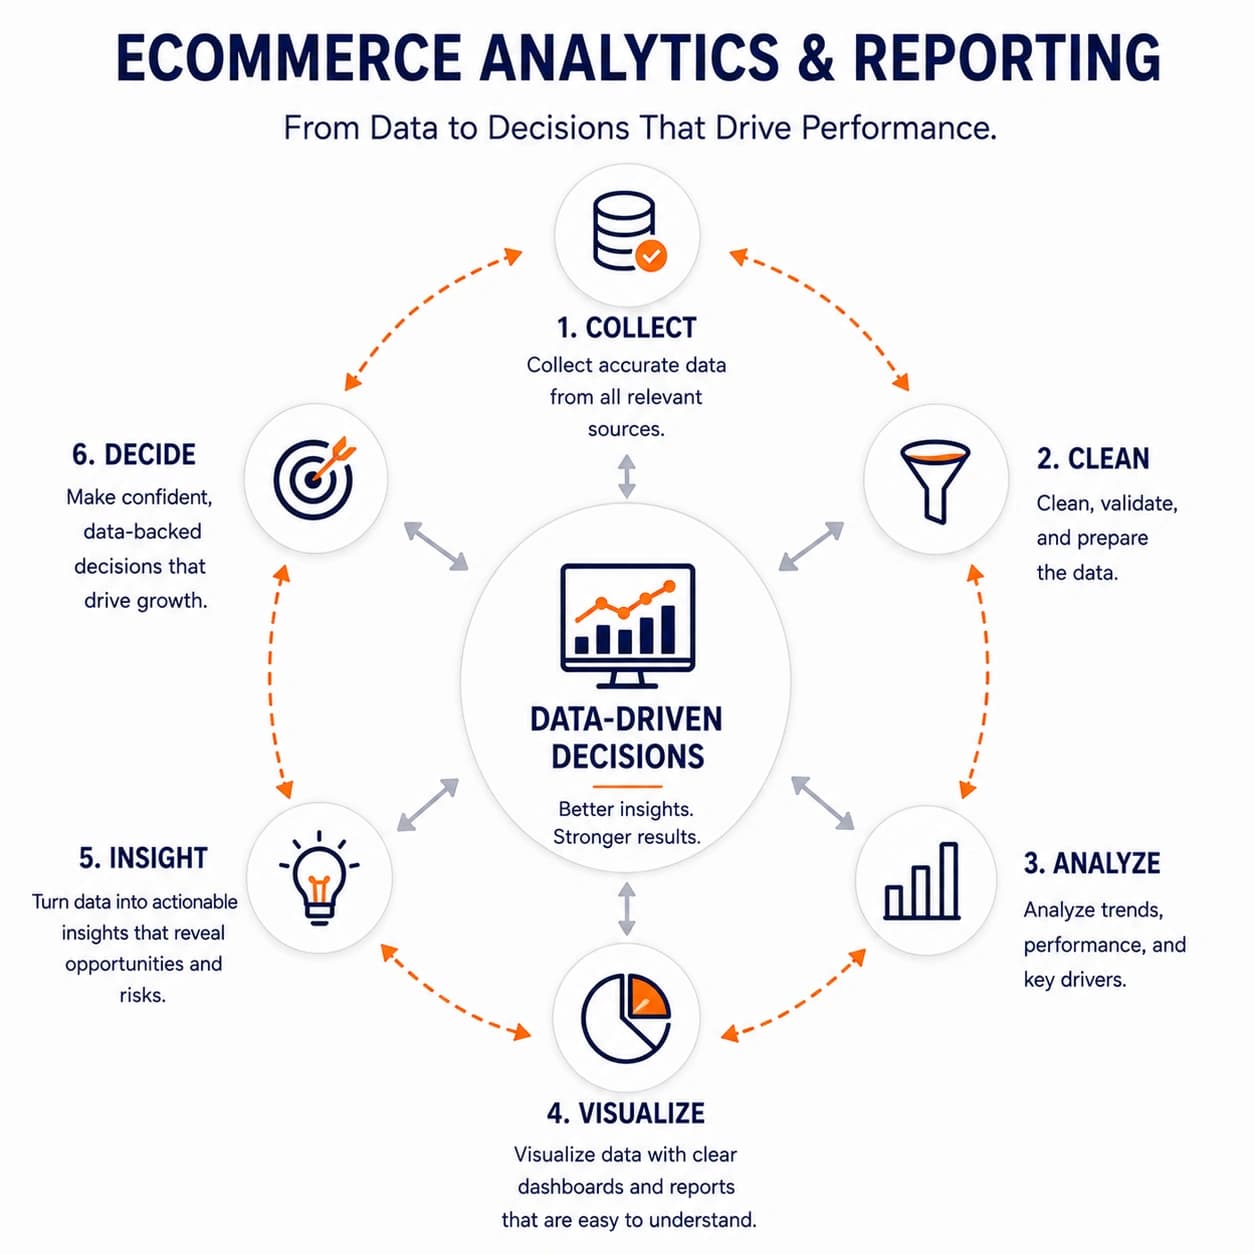
We start with the decisions the business needs to make, then work backward to the KPIs, source data, definitions, and reporting required to support them.
The goal is not more dashboards. It is reporting people can understand, trust, and act on.
Why This Matters
Reliable reporting helps teams spend less time debating numbers and more time acting on what they show.
Where We Review Ecommerce Performance & Visibility
Review reporting across management, revenue, channels, customers, orders, inventory, fulfillment, returns, commercial performance, and operational exceptions.
Executive & Management Reporting
Review whether leadership has a consistent view of the business across commercial and operational performance.
Review
- Revenue
- Order volume
- Channel performance
- Conversion
- Customer mix
- Inventory
- Fulfillment
- Returns
- Service
- Backlog
- Exceptions
- Operational trends
- Target vs actual
- Weekly/monthly management reporting
Outcome
Create a management view that connects growth with the operation responsible for delivering it.
Sales & Revenue Reporting
Review how sales and revenue performance is calculated and compared across channels, products, customers, and time periods.
Review
- Gross sales
- Net sales
- Discounts
- Refunds
- Cancellations
- Taxes where relevant
- Channel revenue
- Product revenue
- Category revenue
- Location revenue
- B2B vs B2C
- New vs repeat customers
- Period comparisons
- Target vs actual
Outcome
Create a clearer and more consistent understanding of where revenue is coming from and how reported sales translate into actual commercial performance.
Channel Performance
Review how different commerce channels are measured using consistent definitions.
Channels May Include
- Direct ecommerce
- Marketplaces
- Retail stores
- POS
- B2B
- Wholesale
- Subscriptions
- Social commerce
- Partner channels
Review
- Sales
- Orders
- Average order value
- Customer mix
- Inventory
- Returns
- Fulfillment
- Fees
- Margin where available
- Channel-specific exceptions
Outcome
Give management a clearer basis for comparing channel performance rather than relying on platform-specific metrics in isolation.
Customer & Conversion Reporting
Review how customer and conversion metrics connect to actual order and revenue performance.
Review
- Traffic
- Sessions
- Conversion
- New customers
- Repeat customers
- Average order value
- Customer cohorts
- Purchase frequency
- Retention
- Customer lifecycle
- Cart abandonment
- Channel/source information
- CRM data
- Order history
Outcome
Create a more reliable customer-to-order reporting model without turning the page into a marketing-performance service.
Order Management Reporting
Review whether teams can see how orders are moving through the operation.
Potential Measures
- Orders received
- Orders validated
- Orders released
- Backlog
- Order holds
- Delayed orders
- Backorders
- Partial orders
- Cancellations
- Order changes
- Exception volume
- Order cycle time
- Orders by channel
- Orders by fulfillment location
- Completion rate
Outcome
Create operational visibility into order flow and exceptions.
Inventory Reporting
Review whether inventory reporting reflects what the business can actually sell and fulfill.
Potential Measures
- On-hand inventory
- Available inventory
- Committed inventory
- Inventory by location
- Inventory by channel
- Stockouts
- Backorders
- Inventory adjustments
- Receiving backlog
- Transfer backlog
- Slow-moving inventory
- Aged inventory
- Days of inventory
- Inventory accuracy
- Fill rate
Outcome
Create a clearer operational view of inventory availability, movement, and risk.
Fulfillment Reporting
Review how the business measures execution after the order has been accepted.
Potential Measures
- Fulfillment backlog
- Order release time
- Picking time
- Packing time
- Shipment time
- Delivery performance
- Pickup readiness
- Partial fulfillment
- Fulfillment exceptions
- Delayed orders
- Warehouse/store performance
- Order completion time
- Fill rate
Outcome
Give operations clearer visibility into where orders are slowing down or requiring manual intervention.
Returns & Customer Service Reporting
Review whether customer-service and return activity is being used as operational information.
Potential Measures
- Return volume
- Return rate
- Return reasons
- Refund volume
- Refund time
- Service contacts
- Contact reasons
- Repeat contacts
- Unresolved cases
- Escalations
- Resolution time
- Order issues
- Product issues
- Fulfillment issues
- Customer-service backlog
Outcome
Help the business identify recurring operational problems instead of treating every return or support case as an isolated event.
Margin & Commercial Reporting
Review whether revenue reporting includes enough operational and commercial context to support better decisions.
Where Data Is Available, Review
- Sales
- Product cost
- Discounts
- Marketplace fees
- Fulfillment cost
- Shipping cost
- Returns
- Refunds
- Channel cost
- Product/category margin
- Customer/channel profitability
- Promotional performance
Outcome
Help leadership distinguish between activity that creates revenue and activity that creates sustainable commercial value.
Important
Gyan does not position this service as accounting, tax, or financial-audit services.
Exception & Operational Reporting
Review whether teams can quickly see what requires attention instead of searching through every transaction.
Potential Exceptions
- Stockouts
- Backorders
- Delayed orders
- Order holds
- Payment issues
- Fulfillment delays
- Failed integrations
- Inventory discrepancies
- Unusual return activity
- Unresolved customer cases
- Missed operational thresholds
- Channel mismatches
- Incomplete records
Outcome
Create reporting that directs attention to the items requiring action instead of only summarizing what already happened.
Build Reporting From the Source to the Decision
Source
Identify where the underlying customer, order, inventory, revenue, or operational information originates.
Align
Bring definitions, identifiers, statuses, dates, channels, and business rules into a consistent reporting structure.
Calculate
Define how each KPI is measured so teams are working from the same logic.
Validate
Confirm that reported results reconcile with the appropriate source and operational reality.
Interpret
Show what changed, where performance moved, and which exceptions require attention.
Act
Connect reporting to the management or operational decision it was designed to support.
When the Business Has Data but Still Lacks a Clear View
Reporting can appear mature while teams still spend hours reconciling numbers, rebuilding spreadsheets, explaining discrepancies, or answering basic questions about what actually happened.
A closer review helps identify where KPI definitions, source data, ownership, reporting logic, or manual processes are preventing reliable visibility.
Signs the Reporting Environment Needs Attention
 Different teams report different numbers for the same KPI.
- Management reports require repeated spreadsheet consolidation.
- KPI definitions change depending on the system or department.
- Dashboards show totals but hide the exceptions driving performance.
- Inventory, orders, returns, or fulfillment reports do not reflect operational reality.
- Teams spend more time preparing reports than acting on them.
Why This Matters
Reporting loses value when people have to verify the numbers before they can use them.
Turn Ecommerce Data Into a Clearer Reporting Model
KPI Framework
Define which operational and commercial metrics matter, how they are calculated, and who uses them.
Source & Data Map
Document where required reporting information originates and how it moves between systems.
Reporting Ownership Model
Clarify who owns metric definitions, source data, reporting quality, and management review.
Management Reporting Structure
Define the dashboards, scheduled reports, exception views, and management summaries required by different users.
Data & Integration Recommendations
Identify where ERP, ecommerce, marketplaces, CRM, OMS, WMS, customer service, spreadsheets, and other sources need stronger alignment.
Prioritized Reporting Roadmap
Organize KPI, data, dashboard, integration, automation, and implementation requirements by priority and dependency.
A Dashboard Cannot Fix a Metric Nobody Defines the Same Way
Terms that sound simple can mean different things across departments.
Revenue

Gross sales
Net sales
Paid orders
Fulfilled orders
Shipped orders
Revenue after returns
Inventory
On hand
Available
Committed
Sellable
Channel-available
Order Backlog
All open orders
Only overdue orders
Unfulfilled orders
Orders waiting for inventory
Orders waiting for payment
Before Reporting Can Become Reliable
What the metric means
Where it comes from
How it is calculated
When it is updated
Who owns it
Operational Reporting Should Show Where Attention Is Required
What Changed?
Show meaningful changes in performance rather than forcing managers to compare every number manually.
What Is Outside the Expected Range?
Surface items that cross agreed operational thresholds.
Where Is the Work Stuck?
Make backlog, delays, unresolved exceptions, and workflow bottlenecks visible.
Who Needs to Act?
Connect the exception with the team, workflow, or system responsible for the next step.
The goal is not simply to create more visibility. It is to make important operational information easier to act on.
Not Every Metric Belongs on a Real-Time Dashboard
Daily Operational Visibility
For information requiring frequent action.
Order backlog
Inventory exceptions
Fulfillment delays
Failed integrations
Unresolved customer cases
Weekly Management Review
For performance trends, bottlenecks, capacity, and cross-functional management decisions.
Channel performance
Order cycle time
Inventory trends
Return trends
Service demand
Operational exceptions
Monthly Commercial Review
For broader business performance and strategic decisions.
Revenue
Customer performance
Product/category performance
Channel performance
Margin where available
Growth trends
How an Ecommerce Analytics & Reporting Engagement Works
Analytics & Reporting Fit Call
We discuss the reports leadership currently uses, the systems involved, recurring reporting problems, KPI disagreements, manual work, and the decisions teams are trying to make.
Reporting, KPI & Data Review
We review the required decisions, current reports, KPI definitions, source systems, data flows, reconciliation points, manual reporting, and operational visibility gaps.
Reporting Roadmap & Implementation Direction
We define the prioritized KPI framework, reporting structure, data requirements, integration needs, dashboards, automation, and implementation opportunities required to create clearer visibility.
30-minute call
No obligation
Review and implementation scoped separately
Who We Work With
We work with ecommerce businesses where reporting depends on multiple channels, platforms, systems, teams, or manual reconciliation processes.
This Tends to Be a Strong Fit If
Teams regularly disagree about which performance numbers are correct.
Management reporting depends heavily on spreadsheets and manual consolidation.
Operational problems are difficult to see until someone investigates them manually.
Leadership needs clearer visibility before making commercial or operational decisions.
This May Not Be the Right Fit If
You only need Google Analytics installed or configured.
You only need a one-time spreadsheet or static report.
You only want a prebuilt dashboard without defining the underlying KPIs.
You want reporting technology without clarifying data ownership and business definitions first.
Not Sure Where Reporting Is Breaking Down?
Start with a fit call to identify whether the constraint sits in KPI definitions, source data, reconciliation, reporting structure, or decision visibility.
When Better Reporting Requires Technology
Commerce Dashboards & BI
Implement operational dashboards, management reporting, KPI views, exception reporting, and multi-system analytics around defined reporting requirements.
Ecommerce Systems Integration
Connect ecommerce, marketplaces, ERP, OMS, WMS, CRM, customer-service systems, databases, and reporting environments.
Automated Reporting Workflows
Automate scheduled reports, data preparation, alerts, notifications, and recurring reporting processes.
Data Models & Reporting Layers
Create structured reporting models that align source information before it reaches dashboards and management reports.
AI-Assisted Reporting & Analysis
Use AI for defined reporting-support use cases such as summarizing changes, explaining exceptions, retrieving operational context, or preparing management briefings.
Custom Reporting Applications
Build operational reporting portals, management tools, exception queues, and custom applications where standard BI platforms do not adequately support the workflow.
Ecommerce Analytics & Reporting and Dashboards & BI Are Connected but Solve Different Problems
They work together, but they begin with different questions.
Ecommerce Analytics & Reporting
Focuses on what the business needs to understand, which KPIs matter, how they should be defined, where the data originates, and what information is required to support operational and management decisions.

Commerce Dashboards & BI
Focuses on technically delivering that reporting through data models, dashboards, visualizations, automated reports, role-based views, and the reporting infrastructure needed to make information accessible.
Reporting and Growth Strategy Are Connected but Solve Different Problems
Ecommerce Analytics & Reporting
Focuses on creating a trusted view of customer, revenue, order, inventory, fulfillment, channel, and operational performance.
Ecommerce Growth Strategy
Focuses on deciding how acquisition, conversion, customer value, retention, and operational capacity should improve to support the next stage of growth.
Go Deeper Into the Operation Behind the Metrics
Ecommerce Order Management
For order lifecycle, routing, status, exceptions, and ownership.
Inventory Management & Fulfillment
For inventory accuracy, availability, allocation, warehouses, fulfillment, and returns.
Returns Management & Customer Service
For service demand, returns, refunds, escalations, and resolution workflows.
Ecommerce Customer Experience
For the broader customer journey across buying, fulfillment, service, and repeat business.
Selected Case Studies
Real outcomes from our operations consulting and implementation engagements.
See Ecommerce Analytics & Reporting in Action
Where Is Reporting Losing Clarity?
Find where KPI definitions, source data, reconciliation, or reporting workflows are making decisions harder.
Request an Analytics & Reporting Fit Call→

30-minute call

No obligation

Consulting and implementation scoped separately
Find the Right Ecommerce Operational Starting Point
Reporting problems often point to deeper questions around orders, inventory, customers, systems, data, fulfillment, returns, or operating workflows. Explore the area closest to the problem you are trying to understand.
Explore by Operational Focus
Ecommerce Growth Strategy
Use trusted performance information to understand where growth is being created, constrained, or lost.
Ecommerce Conversion & Revenue Performance
Measure where purchase intent becomes revenue and where commercial or operational friction interrupts it.
Ecommerce Order Management
Create clearer visibility into order volume, status, routing, exceptions, and lifecycle performance.
Inventory Management & Fulfillment
Measure inventory availability, movement, fulfillment performance, capacity, and operational exceptions.
Explore by Technology & Integration
Ecommerce Analytics Dashboard
Turn defined KPIs and trusted data into management views designed around actual decisions.
ERP and Ecommerce Integration
Align ecommerce and ERP information where reporting depends on consistent operational and financial data.
Ecommerce Marketplace Integration
Bring marketplace performance into a clearer cross-channel view of orders, customers, inventory, and revenue.
Ecommerce POS Integration
Connect store and ecommerce data for more complete customer, inventory, order, and revenue reporting.
Common Questions
What is ecommerce analytics and reporting?
Ecommerce analytics and reporting is the process of turning information from ecommerce platforms, orders, customers, inventory, fulfillment, marketplaces, returns, and other operational systems into reliable performance and decision-support reporting.Gyan focuses on the KPI definitions, data sources, reporting structure, and operational decisions behind those reports.
Is this the same as Google Analytics?
No.Google Analytics may be one source of customer and website information, but Ecommerce Analytics & Reporting is broader.It can include ecommerce platforms, ERP, OMS, WMS, CRM, marketplaces, inventory, customer service, finance-related data, and other operational sources.
Can Gyan help if our reports show different numbers?
Yes.The review can examine KPI definitions, systems of record, date logic, status rules, refunds, cancellations, channel mappings, and other causes of reporting differences.
Can you help automate ecommerce reports?
Yes.Where the reporting logic and source data are defined, reporting workflows can potentially be automated through integrations, data pipelines, scheduled reports, alerts, or custom applications.
Can you build ecommerce dashboards?
Yes.Once the reporting requirements are defined, Gyan can implement dashboards and BI environments as a separate Technology & AI Implementation engagement. Link Explore Commerce Dashboards & BI →
Can you combine data from multiple ecommerce channels?
Yes, where the required system access is available.Data from ecommerce platforms, marketplaces, ERP, POS, CRM, OMS, WMS, customer-service systems, databases, and other sources can potentially be aligned into a common reporting model.
Can reporting include inventory and fulfillment?
Yes.Inventory availability, stockouts, backorders, fulfillment backlog, order-cycle time, warehouse performance, returns, and other operational measures can be included where appropriate data is available.
Can reporting include customer-service and returns data?
Yes.Service contacts, contact reasons, return volume, return reasons, refund timing, repeat contacts, escalations, and other operational measures can help identify recurring customer and process problems.
Can AI help with ecommerce reporting?
Yes, where there is a defined use case.AI can assist with summarizing reporting changes, retrieving operational context, preparing management summaries, or supporting analysis of defined exceptions.AI should complement reliable reporting data rather than replace the underlying reporting model.
What is the difference between Ecommerce Analytics & Reporting and Commerce Dashboards & BI?
Ecommerce Analytics & Reporting defines what should be measured, how KPIs are calculated, which data is authoritative, and what information different users need.Commerce Dashboards & BI focuses on technically implementing the dashboards, reporting models, data views, and reporting environment.
Can you help define ecommerce KPIs?
Yes.A reporting engagement can define KPI ownership, calculations, source systems, update frequency, reporting cadence, and how each metric is used operationally.
Request an Analytics & Reporting Fit Call
Tell us where reporting, KPI definitions, dashboards, spreadsheets, data reconciliation, or operational visibility are making it difficult to understand what is happening across the business. We'll use the first 30 minutes to understand the reporting environment, systems involved, and the decisions your team needs the information to support.
Focused on your goals
You decide the next step.
Consulting & implementation